


- AME CAPITALS
- Trading Technology
- Market Overview
-
Help
- 1 — User Manual
- 2 — Trading
- 3 — Analytics
- 4 — AME AutoTrading
- 5 — Mobile trading
-
Getting Started
- 1 — Key elements of the platform interface
- 2 — How to open a demo account
- 3 — How to make the first trade
- 4 — Additional trading features
-
General Principles
- 1 — General Principles
- 2 — The Connection between Orders, Trades, and Positions
- 3 — General scheme of trading operations
- 4 — Position accounting systems
- 5 — Netting System
- 6 — Hedging system
- 7 — Impact of the Position Accounting System
- 8 — Types of Orders
- 9 — Market Order
- 10 — Pending Order
- 11 — Take Profit
- 12 — Stop Loss
- 13 — In the Netting system
- 14 — In the Hedging system
- 15 — Trading Stop
- 16 — The Trading Stop works as follows
- 17 — Order Status
- 18 — Types of execution
- 19 — Execution Policies
-
Market Overview
- 1 — Viewing Quotes of Financial Instruments
- 2 — Quick Addition of Symbols
- 3 — Sorting Symbols
- 4 — Analysis by Sectors and Industries
- 5 — Viewing Fundamental Data
- 6 — Viewing Trading Statistics of Financial Instruments
- 7 — Managing Symbols
- 8 — Relevance of Trading Instruments
- 9 — Commission
-
Placing Trades
- 1 — Opening Positions
- 2 — Placing an Order and General Parameters
- 3 — Managing Positions
- 4 — Where to view current open positions
- 5 — Modifying a Trade
- 6 — What is a Trading Stop and how to set it
- 7 — Closing Positions
- 8 — Setting Pending Orders
- 9 — Setting Limit Orders
- 10 — Setting Stop Orders
- 11 — Managing Pending Orders
- 12 — Alerts and Favorite Trading Pairs
Market Overview
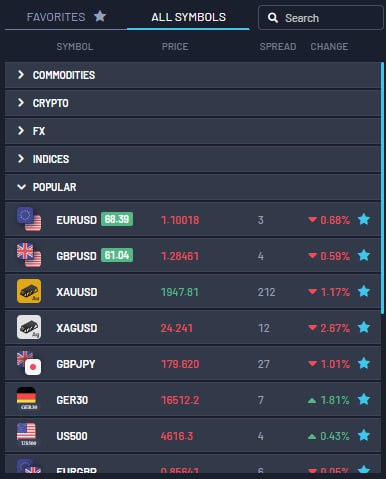
The "Market Watch" window allows you to view price data for trading instruments: quotes, price statistics, and tick charts. Here, you can also check contract specifications and execute trading operations with one click.
Viewing Quotes of Financial Instruments
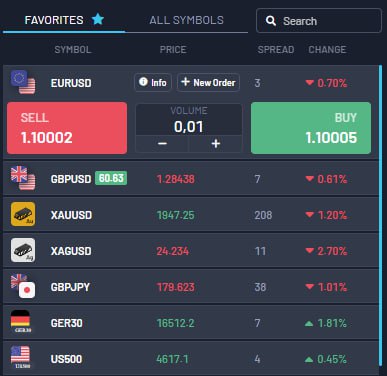
In the "Market Watch" window, real-time quotes of financial instruments are displayed, along with other price data such as spreads, volume, etc.
You can customize the displayed data through the context menu. For example, you can enable the display of the "Source" field, which shows the name of the liquidity provider for the financial instrument.
By double-clicking the left mouse button on any instrument, a window for opening a new position for that instrument will be opened. You can also open a chart for any instrument by dragging it to the chart display area using the mouse (Drag'n'Drop). When doing so, the windows of currently open charts will be closed. If you hold down the "Ctrl" key while dragging, the chart will be opened in a separate tab, and other charts will not be closed.
Prices in the "Market Watch" window are color-coded as follows:
Blue — If the current price is higher than the previous one.
Red — If the current price is lower than the previous one.
Gray — If the price has not changed in the last 15 seconds.
If the symbol has an available price depth (order book) and the last traded price (Last) is being transmitted, then the color is determined based on it. Otherwise, the color is determined based on the Bid price. The server can be configured with its own background color for symbols. This allows visually distinguishing them by type, exchange, or any other properties. If the specified color scheme is not needed, you can enable the "Use System Colors" option in the context menu.
Quick Addition of Symbols
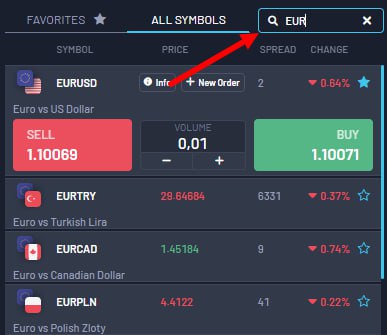
To quickly add a symbol to the "Market Watch" window, click the + sign below the list and enter the symbol name. As you type, a list of matching options will be displayed.
Below the list, you can see the current number of symbols in the market watch and the total number of available symbols. If you work with different brokers or markets, you can save the "Market Watch" settings for each of them. Compile a list of instruments, select the desired columns, and then click "Symbol Sets - Save As". After saving, the set will be available for quick switching through the same menu.
Sorting Symbols
To sort the list of symbols, click on the name of any column. For example, you can sort the list by symbol name, closing price, daily change, etc. The context menu also provides several commonly used sorting options. For example, sorting by the top gainers and losers, calculated based on the daily price change of the instrument, will be convenient for trading on stock markets.
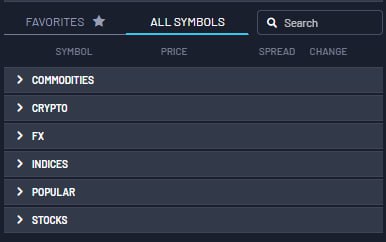
Analysis by Sectors and Industries
Financial instruments have properties that indicate the sector and industry they belong to. Thanks to this, in the Market Watch, you can easily conduct comprehensive analysis. Select the desired category from the menu, and all available instruments from that category will be added to the list.
You can save your own sets of symbols and switch between them in a couple of clicks. Click "Symbol Sets - Save" and specify the name of the set. The file will not only save the list of instruments but also the set of selected columns, so you won't have to configure the Market Watch every time from scratch.
Viewing Fundamental Data
You can easily access fundamental data for any instrument on popular aggregator websites such as "Google Finance" and many others.
Viewing Trading Statistics of Financial Instruments
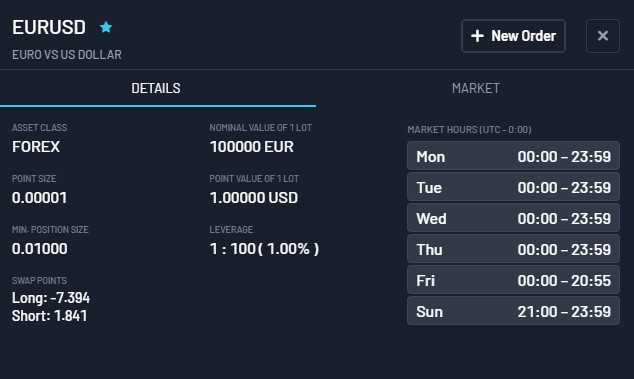
To view statistical information, select a financial instrument on the "Symbols" tab and switch to the "Info" tab. .
Statistical information includes:
Bid — the bid price;
B. High — Bid High, the highest bid price for the current da;
B. Low — Bid Low, the lowest bid price for the current day;
Ask — the ask price;
A. High — Ask High, the highest ask price for the current day;
A. Low — Ask Low, the lowest ask price for the current day;
Last — the last price at which a trade was executed;
L. High — Last High, the highest price at which a trade was executed for the current da;
L. Low — Last Low, the lowest price at which a trade was executed for the current da;
Volume — the volume of the last executed trade;
V. High — Volume High, the maximum volume of a single executed trade for the current day;
V. Low — Volume Low, the minimum volume of a single executed trade for the current da;
Trades — the total number of trades executed during the current sessi;
Trade Volume — the total volume of trades executed during the current session;
Turnover — the turnover of the instrument during the current session;
Open Interest — the total volume of outstanding contracts (futures, options) for which settlement has not yet been made;
Buy Orders — the total number of buy orders;
Buy Order Volume — the total volume of buy orders;
Sell Orders — the total number of sell orders;
Sell Order Volume — the total volume of sell orders;
Opening Price — the opening price of the last (current) session;
Closing Price/strong> — the closing price of the last (current) session;
Weighted Average Price — the weighted average price for the session;
Clearing Price — the calculated price of the previous session;
Daily Change - shows the percentage difference between the last price of the instrument and the closing price of the last session. The calculation formula depends on the charting mode for the instrument:
For Last prices:((Last - Last Session Closing Price) / Last Session Closing Price) * 100
For Bid prices: ((Bid - Last Session Closing Price) / Last Session Closing Price) * 100.
For futures instruments, if provided by the broker (non-zero), the Clearing Price is used instead of the last session closing price:
For Last prices: ((Last - Clearing Price) / Clearing Price) * 100
For Bid prices: ((Bid - Clearing Price) / Clearing Price) * 100.
.
Delta - the delta of the option. Delta, theta, gamma, vega, rho, and omega are referred to as "Greeks" - statistical measures for assessing the sensitivity of an option's price to changes in various parameters: strike price, volatility, etc.
Theta — the theta of the option.
Gamma — the gamma of the option.
Vega — the vega of the option.
Rho — the rho of the option.
Omega — the omega of the option.
Sensitivity - the sensitivity of the option. It indicates how many points the price of the underlying asset of the option should change for the option's price to change by one point.
Managing Symbols
You can open the symbol management window using the "Symbols" command from the context menu of the "Market Watch" window. This window allows you to hide and show symbols in this window and view their properties.
Here, all symbols available in the platform are displayed. By clicking on the symbol name, you can hide or show it in the "All Symbols" window. You can also add popular assets to the "Favorites" section.
For quick symbol search, use the filter string located at the top of the window. Enter a few letters of the symbol name or description in the filter, and the list of symbols matching the search will be displayed below.
Relevance of Trading Instruments
To display a more compact list, all instruments with expired expiration dates are hidden from the list. This is especially useful when working in the futures market. An instrument with an expired expiration date is considered irrelevant and is determined by the "Last Trading Day" parameter. This date is indicated in the symbol list in the "Expiration" column. To view all symbols, enable the "Show Expired Contracts" option.
For convenience, the list of symbols is automatically sorted as follows:
· First, instruments without expiration dates
· Then instruments with expiration dates, starting from the nearest date
· Then expired instruments, starting from the most recently expired
· Then in alphabetical order
The "Auto Remove Expired" option in the context menu is used for automatically replacing expired symbols with relevant ones in the "Market Watch" window. Upon platform restart, symbols with expired expiration dates are hidden, and the most current ones are added in their place. For example, the expired futures contract LKOH 3.15 will be replaced with the next contract on the same underlying asset, LKOH 6.15.
At the same time, symbols are also replaced in corresponding open charts, but only if no expert advisors are running on them.
Commission
Here, information about the commissions charged by the broker for trading a particular instrument is displayed. It shows all the details of the calculation:
Commissions can be single-tiered or multi-tiered, meaning they can be charged at a fixed rate regardless of the trade/volume size or vary based on their magnitude. The corresponding information is shown in the specification.
Commissions can be charged immediately upon executing the trade or at the end of the trading day/month.
Commissions can be applied based on the trade direction: for entry, for exit, or for both types of operations.
Commissions can be charged per lot or per trade.
Commissions can be denominated in different ways: in money, percentages, or pips.
For example, the following entry means that the commission is applied immediately upon executing entry and exit trades. For trade volume from 0 to 10 lots, the commission is $1.2 per trade. For trade volume from 11 to 20 lots, the commission will be $1.1 per lot for each trade.