- AME CAPITALS
- Trading Technology
- Help AME Trading
Part II. Technical Analysis / Chapter 28. On Balance Volume (OBV) Indicator
In this chapter, we will discuss the On Balance Volume (OBV) indicator. The OBV indicator was first introduced by Joseph Granville in his book "New Key to Stock Market Profits" in 1963. Joseph initially applied the OBV indicator in trading commodity markets, but according to theory, it should work on all financial markets where the concept of volume exists in relation to each trading period. It is no secret that in the Forex market, the concept of trading volume does not exist, as it is impossible to track the true volume of currency transactions on a global scale. To compensate for the lack of important volume information in the Forex market, the concept of tick volume was introduced, which represents the number of quotes received from a broker during the considered trading period. The trend of tick volume change coincides with the trend of change in actual trading volumes (the total amounts involved in transactions) only when considering larger timeframes. Therefore, the OBV indicator in the Forex market is meaningful only when applied to daily, weekly, and monthly charts.
Joseph Granville believed that trading volume is the driving force behind market movements. He argued that changes in prices should follow changes in trading volume in the stock market and metaphorically expressed his view as "volume is the steam that drives the market locomotive." Therefore, the On Balance Volume (OBV) indicator was developed by Granville to forecast major price movements in the market based on a retrospective analysis of price and trading volume. The OBV indicator is one of the first indicators to incorporate trading volume in its formula.
The calculation of the OBV indicator is as follows:
- if C(i) > C(i – 1), then OBV(i) = OBV(i – 1) + V(i),
- if C(i) < C(i – 1), then OBV(i) = OBV(i – 1) – V(i),
- if C(i) = C(i – 1), then OBV(i) = OBV(i – 1),
Where:
C(i) is the closing price of the current trading period,
C(i – 1) is the closing price of the previous trading period,
OBV(i) is the value of the indicator for the current trading period,
OBV(i – 1) is the value of the indicator for the previous trading period,
V(i) is the trading volume of the current trading period
For the first bar, the OBV indicator is set to zero and not taken into account, i.e., OBV(0) = 0. Subsequently, the indicator is calculated cumulatively by adding or subtracting the trading volume based on the direction of the closing prices of adjacent periods.
Joseph Granville provided a series of explanations to illustrate the principles behind the operation of the OBV indicator. The key idea is that sharp volume changes (sharp increases or decreases) at the initial stage do not immediately result in sharp price changes, but they often indicate future significant price movements. This occurs due to the following reason: at the initial stage, large market players such as banks and investment funds start investing significant amounts in a financial asset, while the majority of small market players sell it. Consequently, the volume changes rapidly, while the price is still falling or experiencing minimal growth. Following this, small investors begin to mimic the behavior of financial sharks and also start buying the asset, which leads to its price increase. As we can see, the fact that volume growth precedes price growth is quite logical.
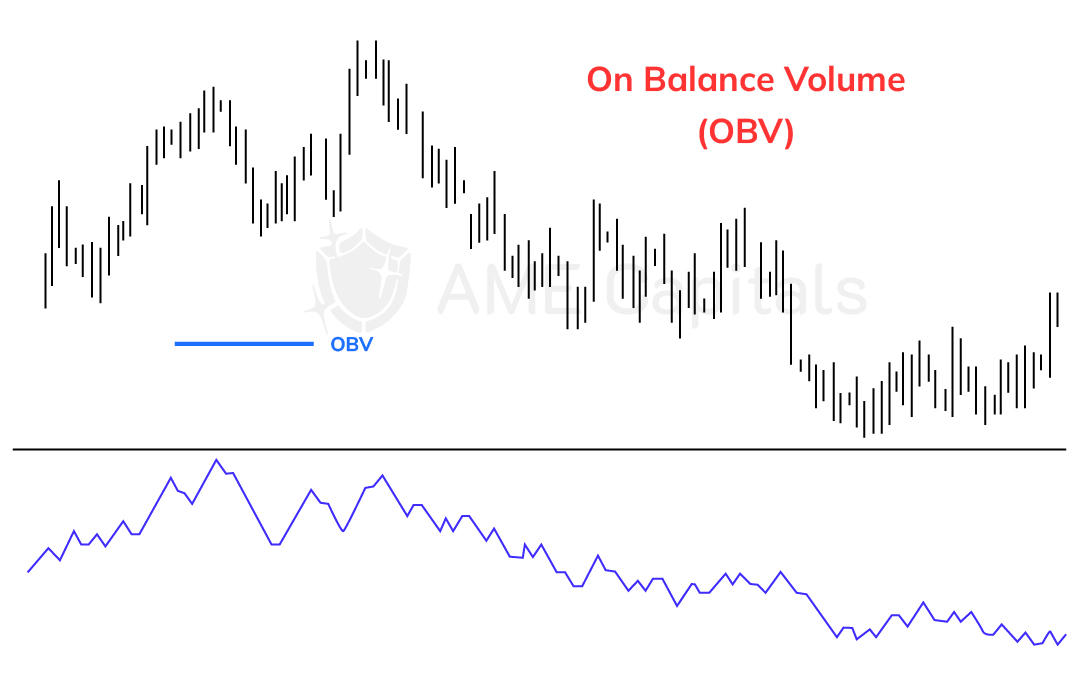
If we look further into the situation, large financial institutions start closing their long positions by selling, while smaller players are still actively buying. Once again, increasing volumes become a precursor to future price reversals. Thus, we observe that professional participants in financial markets acquire assets from average investors at price lows, which eventually leads to future price increases when they sell the assets at maximum prices. Similar reasoning applies to short positions. This is why the OBV indicator often forecasts future significant price fluctuations. The following chart illustrates the On Balance Volume indicator.

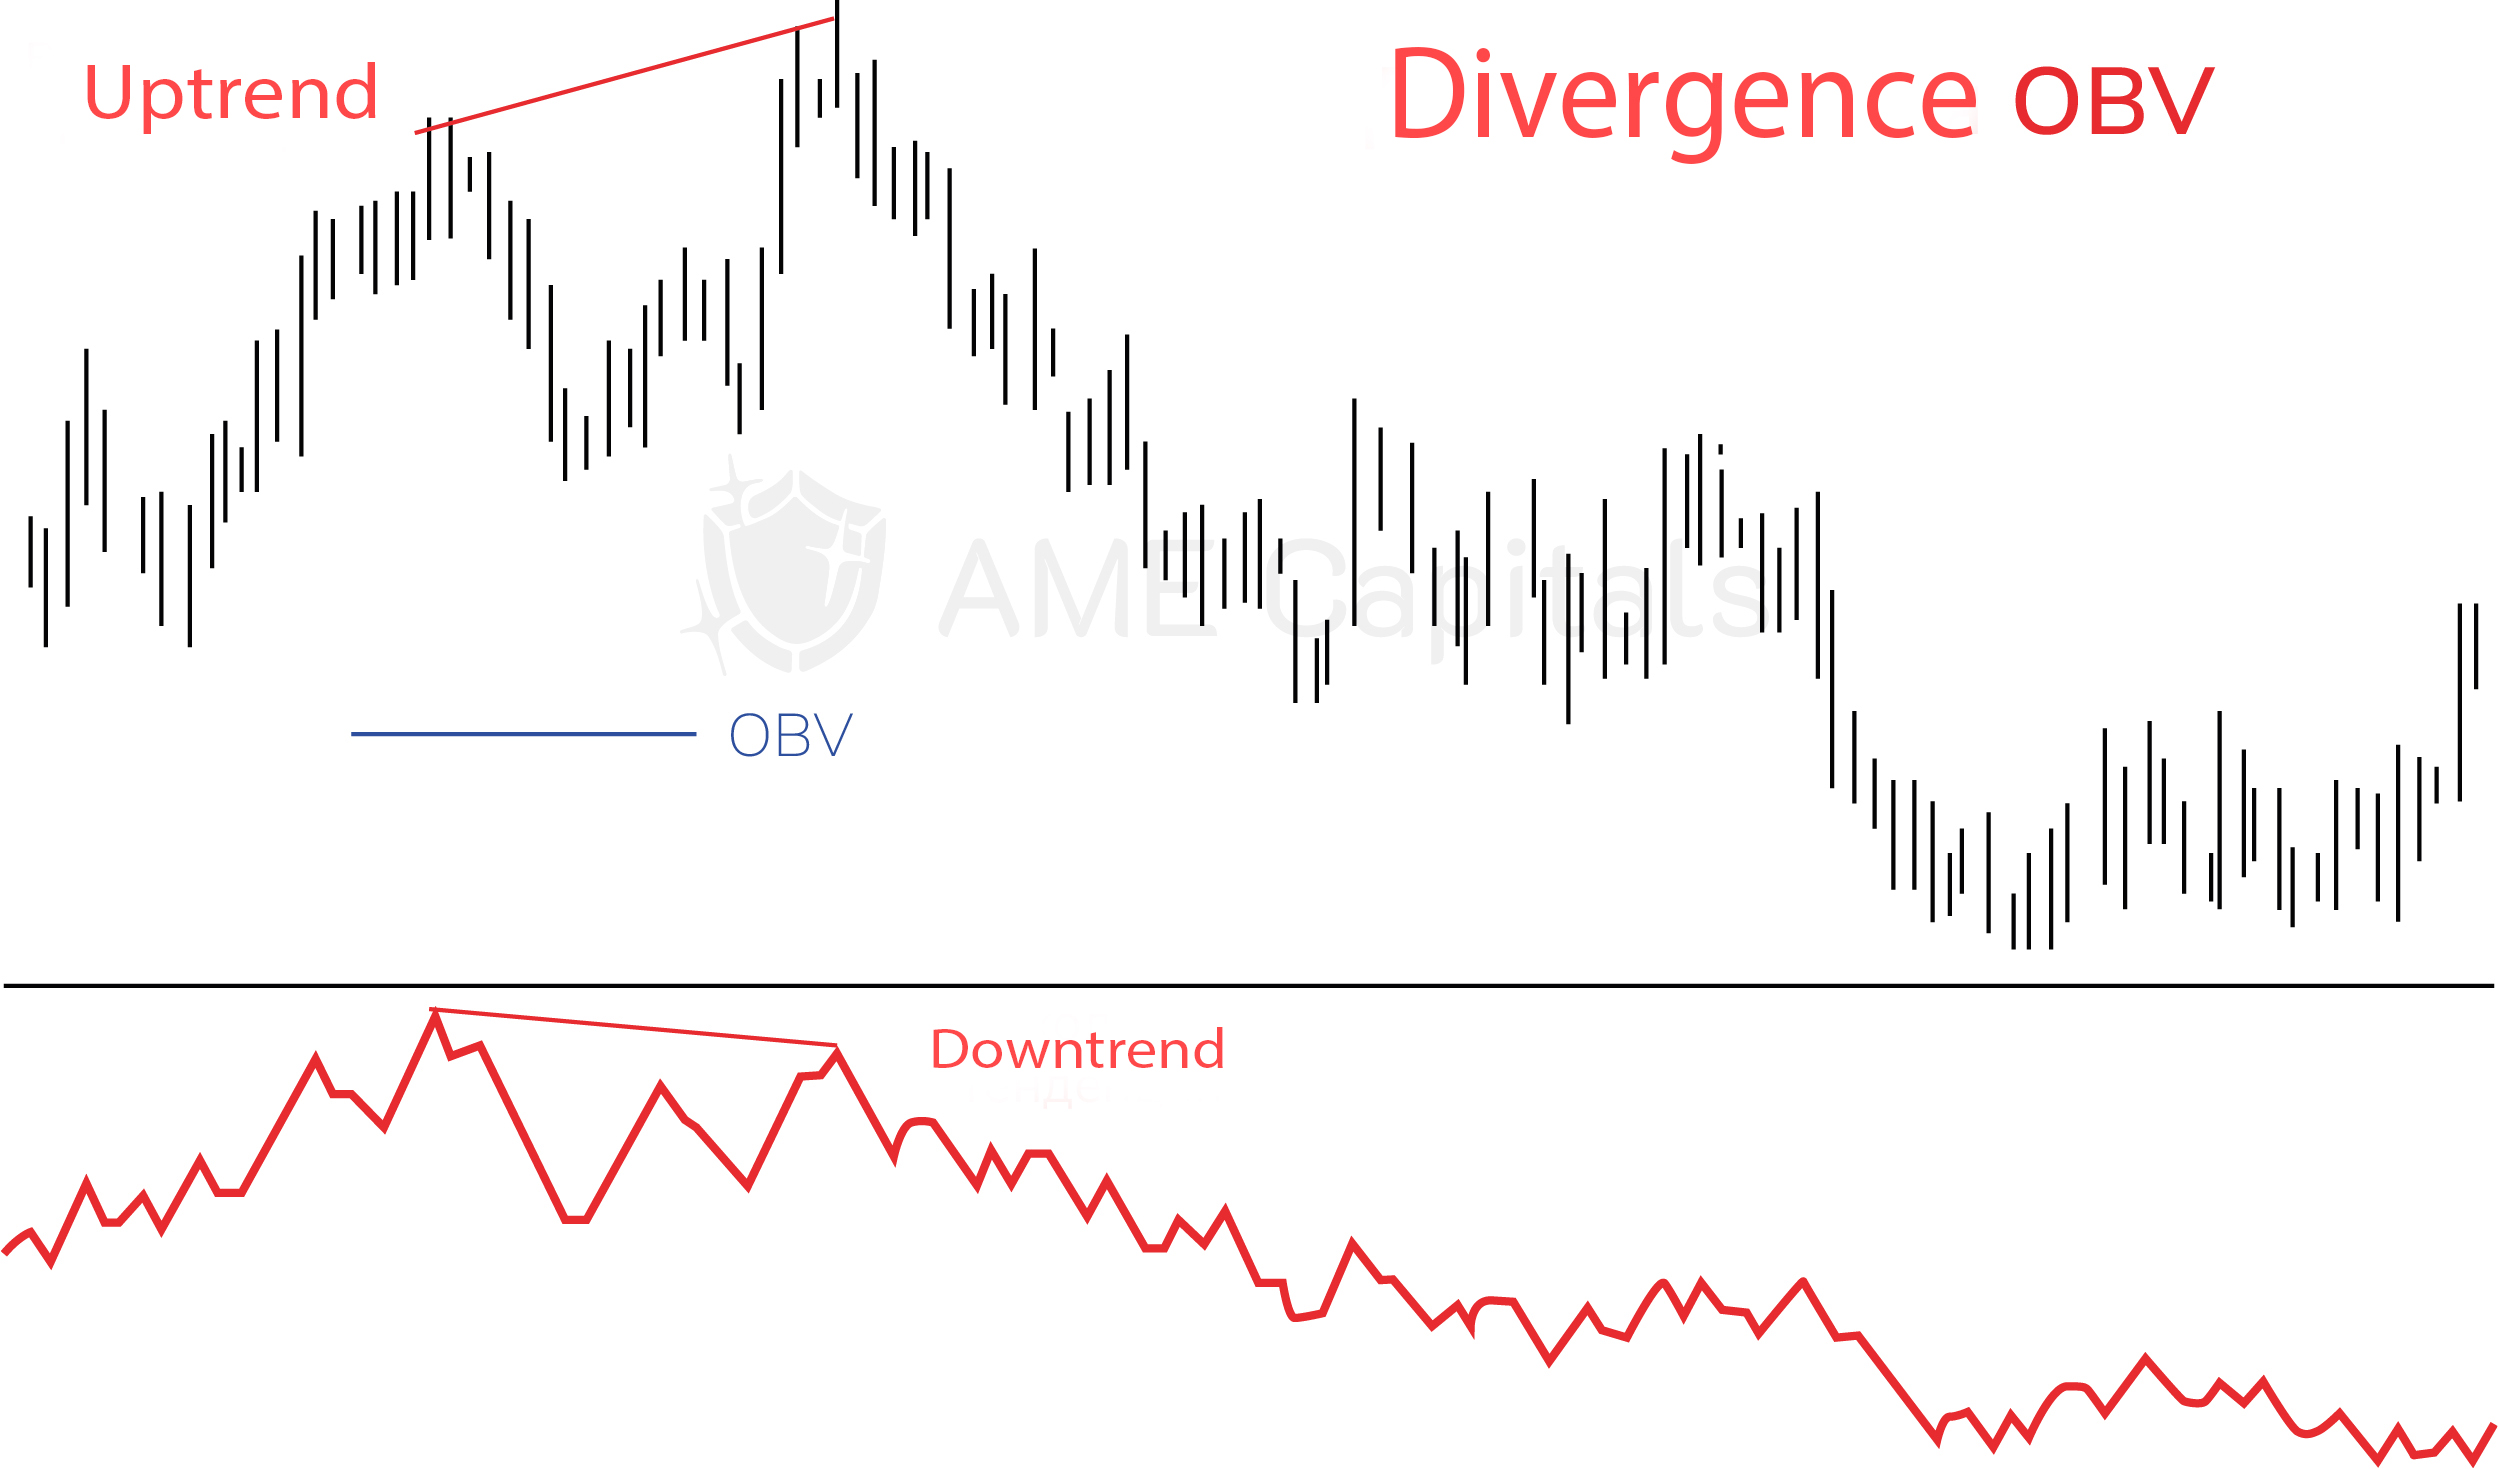
The rise of the OBV chart serves as an indicator that the period of price growth is occurring on increasing volumes. If, amidst active growth in the OBV chart, the price of the financial asset also rises rapidly, the OBV indicator confirms a bullish trend. In such cases, the trend is a result of increasing demand for the underlying asset. However, if the price is moving upward while the OBV indicator shows a decreasing trend, a divergence is observed. In other words, the price is still moving upward due to momentum, but bearish forces are starting to dominate. Divergence signals, in most cases, indicate an upcoming trend reversal. The following chart illustrates a divergence in the OBV indicator, which served as a good indicator of an impending shift in market sentiment.

The On Balance Volume indicator is rarely used on its own to generate trading signals. Traders typically seek confirmation of signals from this indicator among other popular technical analysis tools in the Forex market, including trend indicators and oscillators that we have discussed in previous chapters. The numerical value of the OBV indicator is not of great importance; only the direction of its fluctuations is considered. The main signal from the OBV indicator is the aforementioned divergence between the price chart and the indicator chart. One of the conditions for the future continuation of a trend is usually the confirmation of the trend by trading volumes. If volumes do not confirm the price trend, a future trend reversal or, at the very least, a corrective movement in the opposite direction is more likely.
When using the OBV indicator for technical analysis in the Forex market, traders adhere to several rules:
- If each local price peak on the price chart is confirmed by a local peak on the OBV indicator, it indicates the strength of a bullish trend;
- If each local price trough on the price chart is confirmed by a local trough on the OBV indicator, it indicates the strength of a bearish trend;
- Bullish divergence and bearish convergence (divergences) indicate the weakness of an upward or downward trend, respectively.;
- Trendlines are often drawn on the OBV chart. A breakout of the trendline on the indicator chart may indicate an upcoming breakout of the trendline on the price chart and, consequently, a change in the dominant trend. However, since the OBV indicator can generate many false signals, traders typically wait for several trading periods to confirm a trading signal after a trendline breakout.
In conclusion, it is worth noting once again that Joseph Granville invented his indicator to analyze price movements in stock markets. Each stock exchange has its own opening and closing hours, and the volume of contracts traded during the trading day is recorded and known to all market participants. In the Forex market, the concept of trading volume does not exist. It is nearly impossible to calculate the total value of all currency conversion transactions across all banks worldwide for a given trading period. Therefore, the concept of tick volume is used in the Forex market, representing the number of quotes received from brokers during a trading period. Typically, the frequency of quote arrivals is related to the volume and value of transactions in the financial instrument on the market. However, the correlation (similarity) between real volume and tick volume is only evident on larger timeframes, starting from daily charts. Using the OBV indicator on hourly or smaller timeframes is not recommended.


