


- AME CAPITALS
- Trading Technology
- Help AME Trading
Part II. Technical Analysis / Chapter 22. Ichimoku Kinko Hyo Indicator: Generating Trading Signals
In the previous chapter, we extensively covered the construction principles of the Ichimoku indicator. In this chapter, we will explore the trading signals provided by the indicator lines and their key characteristics. All Ichimoku indicator signals can be categorized into three major groups:
- Crossings between the indicator lines (specifically the Tenkan, Kijun, and Senkou Span lines);
- Price bounces off or breakouts through the indicator lines;
- Breakouts of the Chinkou Span line through the price chart or bounces of this line from the price chart (although the standard teachings of the theory by Hosoda do not explicitly cover breakouts, they also generate reliable signals in practice).
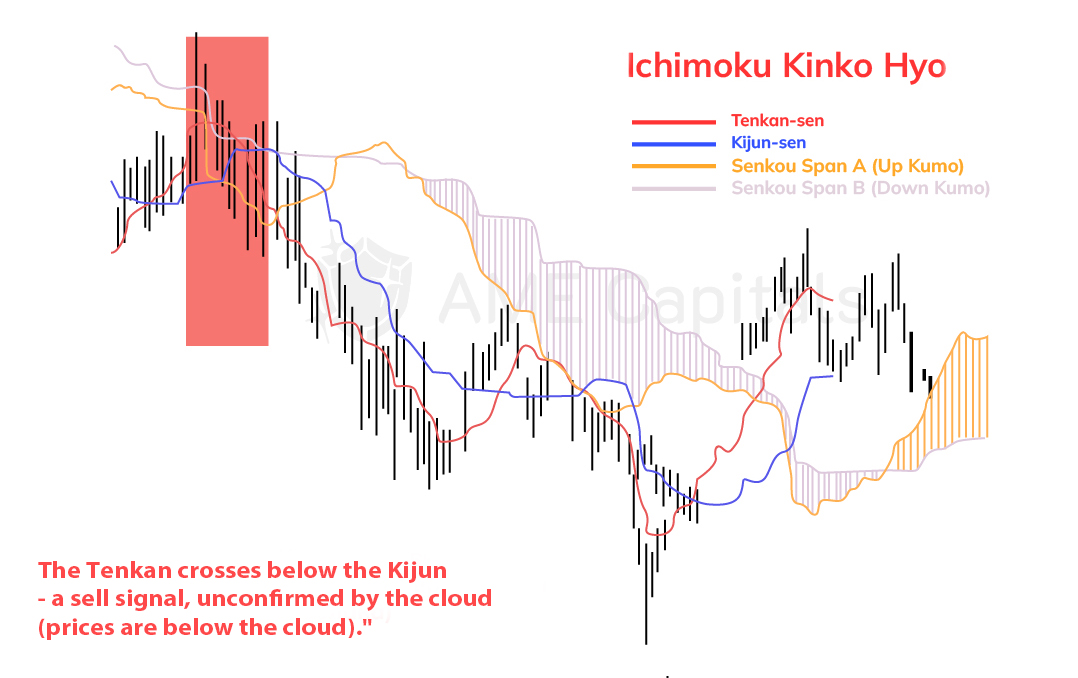
The first signal we will discuss is the crossover signal between the Tenkan and Kijun lines. When the Tenkan line crosses below the Kijun line, a bearish signal called the "dead cross" is generated. Conversely, when the Tenkan line crosses above the Kijun line, a bullish signal known as the "golden cross" is formed. According to the teachings of the Ichimoku indicator's creator, a more reliable bullish signal occurs when the price chart is near the lower boundary of the cloud formed by the Senkou Span lines. Similarly, a more reliable bearish signal occurs when the price chart is near the upper boundary of the cloud. The following two charts illustrate the crossover signal between the Tenkan and Kijun lines, confirmed (in the first case) and unconfirmed (in the second case) by the cloud.


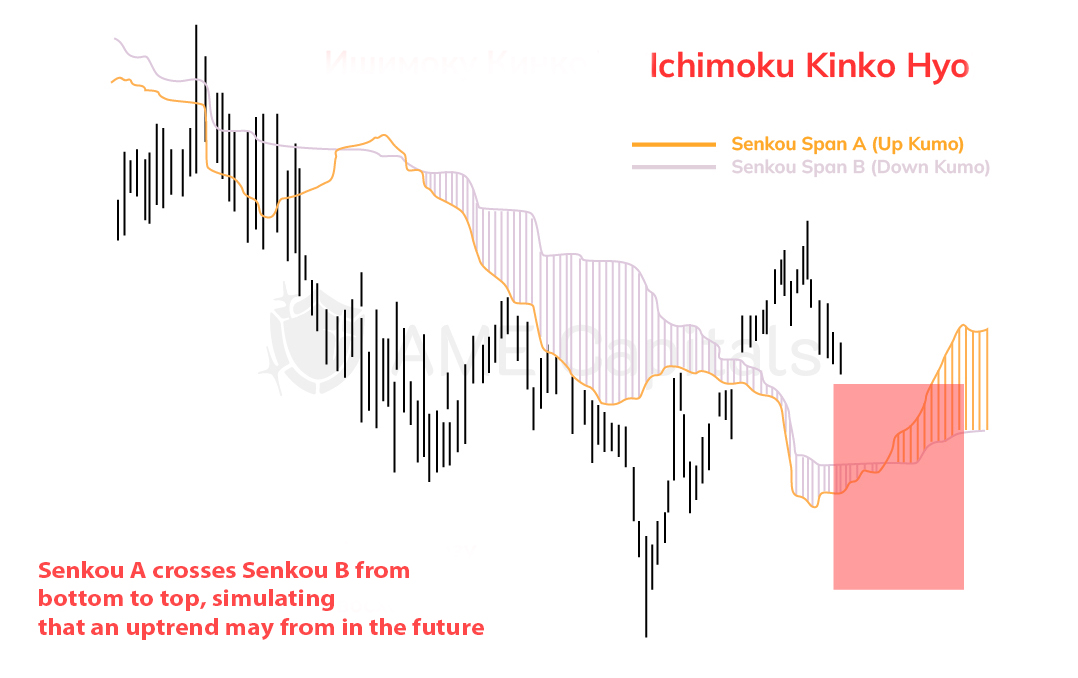
The next Ichimoku signal we will examine is the crossover between the Senkou Span A and Senkou Span B lines. The names of these lines, translated from Japanese, literally mean "leading, moving ahead of the carriage." The point where the A line crosses below the B line is an indicator of a potential shift in the long-term trend to a bearish trend (or at least a future correction). In such cases, opportunities for selling should be sought either immediately after the crossover or in the near future, after confirmation from other Ichimoku indicator lines. Conversely, when the A line crosses above the B line, it indicates the potential formation of a long-term bullish trend, suggesting opportunities for opening long positions (buying). The following chart demonstrates the crossover signal between the Senkou Span lines. Note that both lines are shifted by the value of the indicator's second parameter (defaulted to 26), causing them to lead the price chart in time.
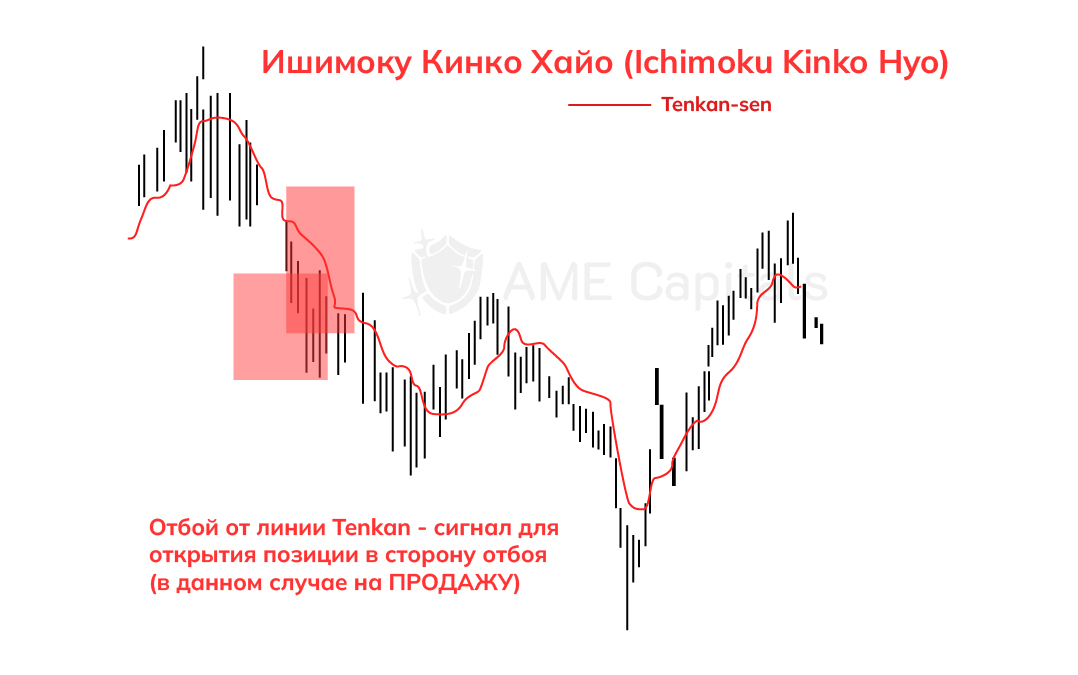
The next signal we will discuss is the price chart bouncing off the Tenkan line. The Tenkan line itself represents the short-term trend curve. If it is rising, it indicates a short-term bullish trend, and if it is falling, it indicates a short-term bearish trend. A bounce off the Tenkan line signals the end of a corrective move and the continuation of the existing short-term trend, in the direction of which a position should be opened. However, since the period of constructing the Tenkan line is relatively short (Hosoda uses a default value of 9), it generates many false signals (as it passes very close to the price chart). Therefore, Hosoda, the creator of the Ichimoku indicator, suggested seeking confirmation of signals in candlestick patterns or on the Kagi chart (a unique equivalent of tic-tac-toe chart). Naturally, the aforementioned applies primarily to the stock market, as candlestick analysis is not as effective in the Forex market. The daily candle, as such, loses its psychological significance (the opening and closing of trading on the exchange). Confirmation of signals can also be sought from other Ichimoku lines or using other technical analysis indicators. The bounce of the price chart off the Tenkan line is shown in the following chart.
Similarly, we consider the signal of the price chart bouncing off the Kijun line, with the difference that this line represents the medium-term trend. Therefore, there are fewer false signals, and a bounce off the line is more likely to indicate the continuation of the main medium-term price trend after a corrective move. A position should be opened in the direction of the bounce, preferably confirming the signal with other technical analysis indicators. The bounce of the price chart off the Kijun line is shown in the following chart.

Another important signal is the bounce of the price chart off the Senkou Span lines that form the cloud. In general, a bounce off the Senkou Span B line (representing a longer-term trend) is considered a more reliable signal than a bounce off the Senkou Span A line. However, in practice, both lines often provide good signals. Opening a position should be done in the direction of the bounce after additional confirmation of the signal from nearby technical indicators, graphical patterns, or other popular trader tools. The bounce of the price chart off the Senkou Span A line is shown in the following chart. Note that in this example, the line proved to be a strong resistance curve in a bearish market.

The author of the Ichimoku indicator uses the concept of the "three-line signal" in his theory. This refers to a market scenario where the Tenkan, Kijun, and Senkou Span B lines align hierarchically in a specific sequence. In such a situation, a price bounce off these lines is considered a reliable signal for opening a position in the direction of the bounce, while a sequential breakthrough of multiple lines may indicate a trend reversal. The "three-line signal" is shown in the following chart.

One of the fairly reliable signals for a long-term trend change is the price chart crossing the Senkou Span B line. Since the cloud formed by the Senkou Span lines is shifted to the right by the value of the indicator's second parameter (typically 26), confirmation of a price trend change can be obtained in advance by analyzing the shape and color of the cloud in the future (after 26 bars) at the moment of the price crossing the Senkou Span B line. When a signal is received, a position is opened in the direction of the indicator line breakthrough. The following chart shows sell and buy signals obtained when the price chart crosses the Senkou Span B line.

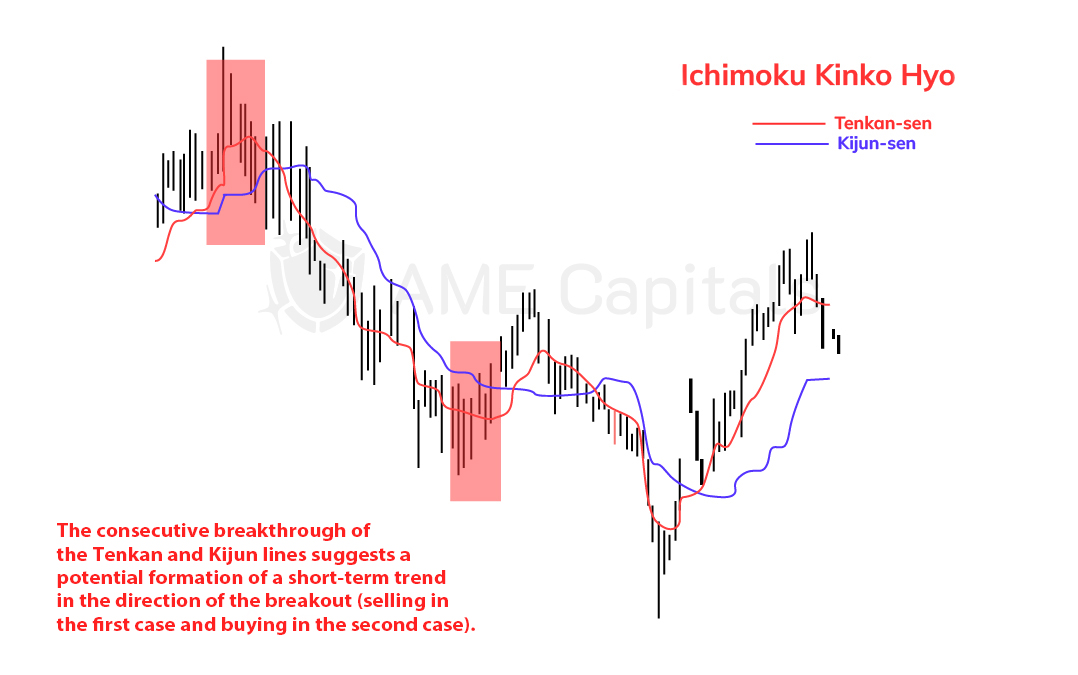
A sequential breakthrough of the Tenkan and Kijun lines can signal the formation of a short-term (or medium-term) trend. A position is opened in the direction of the breakthrough after the Kijun line is crossed. It is advisable to seek confirmation of this signal from other technical indicators or by using chart patterns. The sequential breakthrough of the Tenkan and Kijun lines is shown in the following chart.
The last signal we will discuss in the context of studying the Ichimoku indicator is provided when the Chinkou Span line crosses the price chart. If the Chinkou Span line crosses the chart from below to above, a buy signal is generated, and if it crosses from above to below, a sell signal is generated. It is important to note that the Chinkou Span line is shifted to the left relative to the price chart (it lags behind it) by the value of the indicator's second parameter (typically 26). Therefore, we obtain a signal to open a position by analyzing the behavior of the line in the past (26 bars ago). In other words, we receive a signal based on a bar for which the Chinkou Span line has not yet been plotted. This approach when receiving a signal from the Chinkou Span line is shown in the following chart.
In conclusion, we have covered the main signals of the Ichimoku indicator. It is important to remember that the Ichimoku indicator was originally developed for analyzing weekly charts of the Nikkei 225 index in the Japanese stock market. Therefore, for a long time, this indicator was primarily used by long-term investors. With the growing popularity of Forex trading, attempts were made to adapt the Ichimoku indicator for analyzing currency price behavior. However, analysts encountered several difficulties along the way. Firstly, most traders prefer to use daily and hourly charts in Forex trading to obtain an acceptable number of signals. In such conditions, the default parameter values of the Ichimoku indicator lose their economic significance as they no longer reflect the cyclical nature of market processes. Therefore, for effective use of the Ichimoku indicator in Forex trading, further research is necessary, and each trader conducts it in their own way. Additionally, understanding the principles of the Ichimoku indicator can serve as a good starting point for creating custom technical analysis indicators.