


- AME CAPITALS
- Trading Technology
- Help AME Trading
Part II. Technical Analysis / Chapter 23. Oscillators and Their Characteristics
Most of the technical indicators we have discussed so far are trend indicators. Their main task is to determine the prevailing price trend in the financial instrument of interest. The main problem with all trend indicators is their lagging nature. In other words, they provide delayed signals in the market. This prevents traders from receiving timely signals and often leads to entering the market too late, missing out on a significant part of the price movement in the trend direction. Using trend indicators in their pure form either results in missing out on potential profits or entering the market with a significant delay, already at the trend reversal or corrective wave. In this chapter, we will talk about another group of indicators called oscillators and discuss their main differences from trend indicators and the advantages they offer compared to them.
Oscillators in technical analysis include indicators such as the momentum indicator, stochastic oscillator, Williams' percent range, and the relative strength index. These indicators will be discussed in subsequent chapters, but for now, let's focus on the general characteristics shared by all oscillators. When using oscillators in technical analysis, there are at least two main directions to consider, which will be discussed further in this chapter.
A key concept related to oscillators is divergence - a discrepancy in the pattern of behavior between the price chart and the oscillator chart. In other words, divergence occurs when the oscillator and the price move in opposite directions. Divergence can indicate that despite a rapid price movement in one direction, the forces driving that movement are beginning to weaken. There are two types of divergence: negative bearish divergence and positive bullish divergence. Negative bearish divergence occurs when the price chart of a financial instrument reaches a new high, but the oscillator fails to reach a new high. This situation suggests a weakening of buying pressure and the potential formation of a new downtrend or at least a downward correction. Positive bullish divergence occurs when the price reaches a new low, but the oscillator fails to reach a new low. This situation indicates a weakening of selling pressure, and under such conditions, a new uptrend or upward correction may form.
Oscillators are also indicators of overbought and oversold conditions. Each oscillator has its own levels or zones that represent the state of overbought or oversold for a financial asset (currency in the Forex market). When the oscillator chart enters these zones, it may indicate a potential future corrective movement or trend reversal. However, interpreting such oscillator signals should be done with caution. The reason is that due to their construction, oscillators (regarding overbought and oversold zones) are applicable only in calm market conditions (absence of a strong trend), such as in a horizontal price range (a flat market). In the presence of an established trend, for example, a bullish trend, the oscillator can remain in the overbought zone for an extended period, even if there is no actual weakening of buying pressure in the market.
In conclusion, it is important to note that oscillator signals should be considered only in the direction of the current long-term price trend. In other words, buy signals should be considered only in the context of a long-term bullish trend, and sell signals should be considered only in a bearish trend. Trading against the market can lead to significant losses. There are trading strategies that suggest trend indicators should be used on higher timeframes, while oscillators should be used on smaller timeframes. Trend indicators provide insights into the current long-term price trend, while oscillators help identify optimal entry conditions in line with the current trend. In the upcoming chapters, we will explore several oscillators, their construction features, and key trading signals.
Part II. Technical Analysis / Chapter 24. Momentum Indicator
The Momentum Indicator is one of the most common oscillators in Forex technical analysis, although it can only be considered an oscillator to some extent. The Momentum Indicator is also notable for the existence of several algorithms for its construction, and different trading platforms may offer various versions of its implementation.
In its classic form, the Momentum Indicator is calculated as the difference in the price of a financial instrument over a specific time interval (usually using closing prices). The size of the interval is determined by a special coefficient of the indicator, which is commonly set to 14 in most Forex technical analysis programs. Therefore, the value of the Momentum Indicator in its classic form is calculated using the formula:
M(i) = C(i) – C(i – n),
where M(i) represents the value of the Momentum Indicator, C(i) is the current closing price of the trading period (candle), and C(i - n) is the closing price of the trading period (candle) that occurred n timeframes ago. However, in practice, the classic form of the Momentum Indicator described above is rarely used. Another variation of the indicator is implemented in the MetaTrader 4 trading terminal, calculated using the formula:
M(i) = 100 * C(i) / C(i – n),

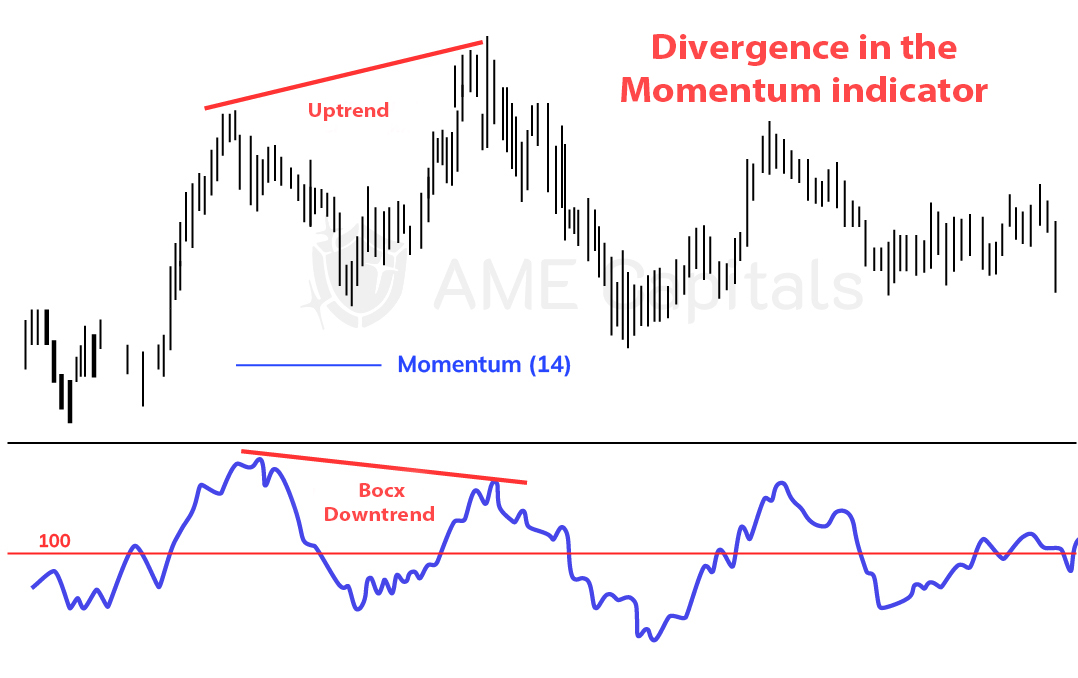
where the variables have the same meaning as in the classic version described above. The following chart shows the Momentum Indicator with a period of 14 (n = 14). As seen in the chart, the Momentum Indicator fluctuates around its average level of 100. The longer the market stays within a horizontal range, the closer the Momentum Indicator's graph is to its average line, and the smaller its amplitude. When a trend forms, the amplitude of the Momentum Indicator sharply increases. Sometimes, moving averages are used to smooth the graph of the indicator.
As mentioned before, the Momentum Indicator is not a classical oscillator as it exhibits properties of both trend indicators and oscillators. A buy signal can occur when the indicator's graph crosses its average line (the 100 level) from below to above, while a sell signal can be generated when the indicator's graph crosses its average line from above to below.
However, traders often use a different approach, treating the Momentum Indicator specifically as an oscillator. In this approach, a sell signal can occur when the indicator's graph rises significantly to its local peak and then starts moving in the opposite direction. Similarly, a buy signal is determined when the indicator's graph reaches its local minimum and begins to reverse upward. It is worth noting that unlike other oscillators, the Momentum Indicator does not have specific overbought and oversold zones. In the context of this indicator, they strongly depend on the preceding prices of the financial instrument (currency quote) in the market. Therefore, overbought and oversold zones are determined by local highs and lows within each specific time range.
A common method of generating signals from the Momentum Indicator is through divergence analysis, which involves observing divergences in the behavior of the price chart and the indicator's graph. For example, if prices on the chart form a sequence of higher highs while the Momentum Indicator fails to reach a new high and demonstrates a decline, a divergence is identified, which can serve as a good indicator of a potential reversal in the current trend or, at the very least, a correction in the current price movement. The following chart example illustrates a divergence where the Momentum Indicator provided a reliable sell signal when the divergence was identified (the price chart reached a new local high while the indicator's graph declined). The formation of a divergence with a buy signal follows a similar pattern, but in the opposite direction.
One significant drawback of the Momentum Indicator is its rapid response to the appearance of new prices in the market that significantly differ from the current prices. High price volatility in the Forex market can lead to significant instability in the indicator's results. Therefore, it is best to consider the Momentum Indicator on a calm market that is in a horizontal range. In such conditions, the indicator can provide reliable signals of the formation of a new trend. And, of course, one should not forget about divergence, which is one of the primary signals in all oscillators.
Part II. Technical Analysis / Chapter 25. Stochastic Indicator
The next oscillator in Forex technical analysis that we will discuss is called the Stochastic Oscillator or simply Stochastic. It has gained widespread popularity as an analytical tool in financial markets, including the Forex market, thanks to George Lane. The Stochastic indicator is integrated into many technical analysis programs and is widely used by traders, especially those who prefer automated trading. The main idea behind the Stochastic Oscillator is to show the position of the current closing price within the price range over a certain period of time in the past.
The Stochastic Oscillator consists of two lines, denoted as %K and %D. The %K line is the main line of the Stochastic indicator and is calculated using the following formula:
%K = (C(i) – L(n)) / (H(n) – L(n)) * 100,
where C(i) is the closing price of the current trading period (candle), L(n) is the lowest price over the last n candles, H(n) is the highest price over the last n candles, and n is the calculation period of the indicator. The standard value for this calculation period is often set to 5. Therefore, if analyzing an hourly chart, the calculation will involve the last 5 hours; if analyzing a daily chart, the calculation will involve the last 5 days, and so on.
In its pure form, the %K line of the Stochastic Indicator is quite volatile and reacts to even small price fluctuations. The %D line is a supplementary line of the Stochastic Indicator and represents a moving average of the %K line. Its main purpose is to smooth out the noise of the main indicator line. The %D line can be calculated in different ways, but typically it is calculated using the formula:
%D = MA(%K, m),
where the MA function refers to a moving average, which can be a simple, weighted, or exponential moving average (depending on the indicator's settings). The parameter m determines the smoothing period of the moving average.
However, sometimes even with smoothing, it is challenging to achieve satisfactory results, as the %K and %D lines may still be highly responsive to price noise, resulting in numerous false trading signals. To further smooth the Stochastic Indicator curves (i.e., to make them slower), a method is applied where the %D line is treated as the %K line after construction. Then, a new %D line is calculated using the moving average formula based on the %K line. The number of iterations for replacing the lines depends on the setting of a special smoothing parameter, denoted as s in the Stochastic Indicator. If this parameter is greater than one (s > 1), the %D line becomes the new %K line, and calculations (moving average) are applied to construct a new %D line based on %K. This process is repeated (s - 1) times, after which the %K and %D lines are finally plotted on the chart.
/p>
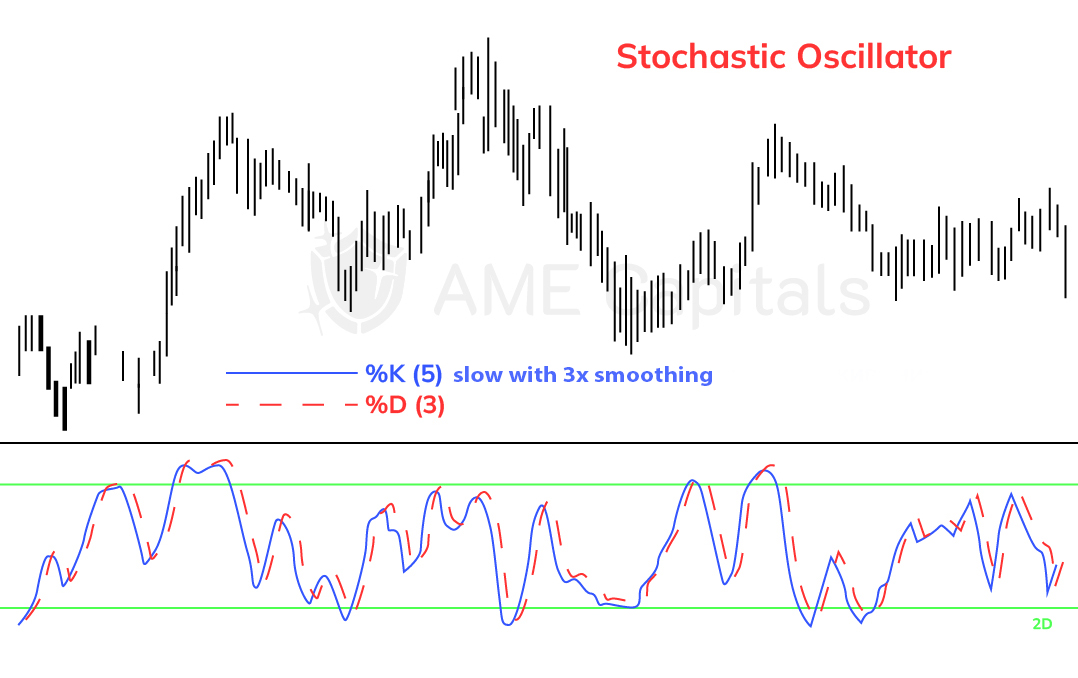
The following example chart illustrates the Stochastic Indicator with n = 5, m = 3, and s = 3. Both lines of the Stochastic Indicator oscillate within the range of 0 to 100. Two significant levels on the Stochastic Oscillator chart are the value of 20, which defines the oversold zone, and the value of 80, which defines the overbought zone.
The Stochastic Indicator is a classic oscillator, so the principle of generating trading signals is practically similar to the general principle for all oscillators. The value of a currency quote in the Forex market at any given moment reflects an implicit agreement among market participants regarding the fair value of the base currency relative to the quote currency. The maximum value of the quote within a specific time period reflects the maximum buying pressure during that period, while the minimum value of the quote within the same time period reflects the maximum selling pressure. The minimum and maximum prices form a price range or corridor. The Stochastic Indicator reflects the ability of buyers and sellers to establish the closing price at the edge of the price range. When the price of the base currency rises, the closing prices of trading periods shift towards the upper end of the price corridor, and when the price of the base currency falls, the closing prices shift towards the lower end.
The main trading signals of the Stochastic Indicator occur during divergence. If the price is rising, forming consecutive local highs, and the local highs of the Stochastic Oscillator show a decline, it indicates a weakening of bullish strength. In the future, a correction in the main trend or a reversal with the formation of a new bearish trend may occur. The most significant situation is when, amidst price growth, the Stochastic Indicator's graph shows two decreasing local highs, with one above the upper significant level (default at 80) and the other below it. An example of such Stochastic Indicator divergence is shown in the following chart.
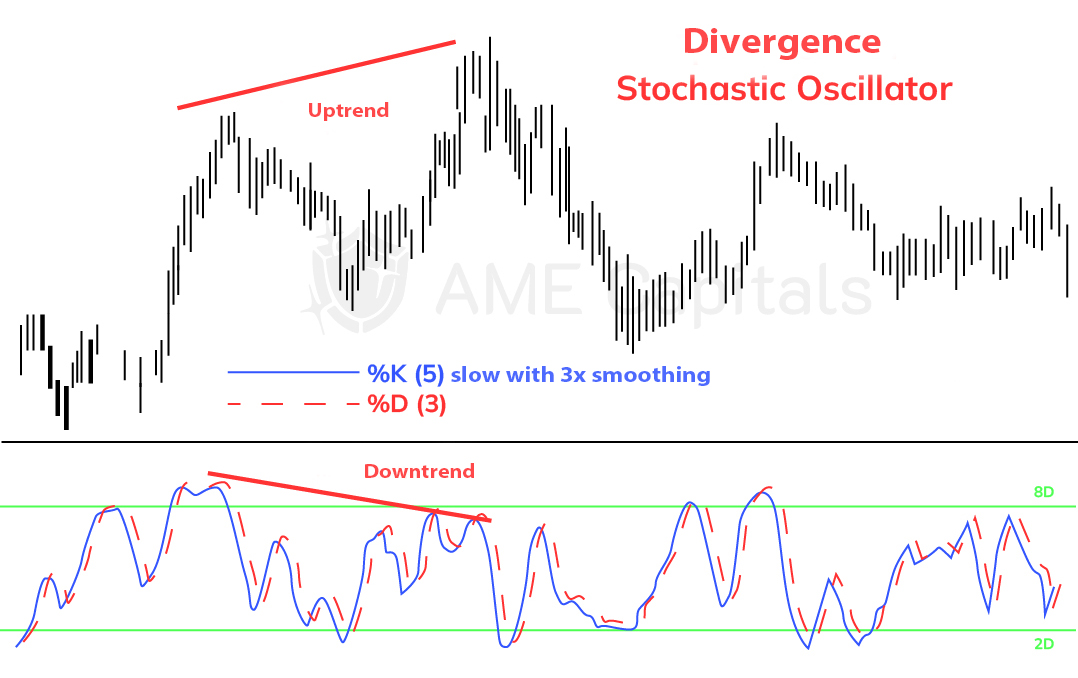
As seen in the chart, the classical divergence provided a good selling signal. Similar reasoning applies in the case of a dominant bearish trend. If the price in its movement forms two decreasing local lows, and the Stochastic Indicator's graph slows down its decline and does not reach the previous local low, it indicates a future price increase, and it is advisable to buy. Moreover, a more significant signal from the Stochastic Oscillator is when the first local low is below the lower significant level (default at 20), and the subsequent local low is above it.
The Stochastic Indicator, being a classic oscillator, also provides signals when significant oversold levels (value 20) and overbought levels (value 80) are crossed. However, as with other oscillators, it is important to note that such signals should be considered only when the Forex market for the analyzed currency pair is in a horizontal range (flat). If the market is in a strong trending movement, the Stochastic Indicator may remain in the overbought or oversold zone for a long time, signaling a possible future trend reversal. However, this may not correspond to the actual market conditions.
The crossover of the %K and %D lines can also be a signal for opening positions. When both lines are moving in the same direction, they confirm an established short-term trend. When the lines intersect, it signals a possible change or weakening of the short-term trend. In other words, if both the %K and %D lines of the Stochastic Indicator are moving upward, it confirms a short-term bullish trend. If both lines are moving downward, it confirms a short-term bearish trend. The moment of the crossover under such circumstances can serve as a trading signal for opening or closing positions with a short-term perspective.
The Stochastic Indicator can be used on any time frame, ranging from hourly to weekly. In general, the Stochastic Oscillator provides more timely trading signals than trend indicators such as the Moving Average Convergence Divergence (MACD). The choice of Stochastic Indicator parameters is crucial. Short-term oscillators are more sensitive to price noise than long-term ones. However, long-term oscillators only provide trading signals at the most significant price extremes, missing out on many small signals (both potentially profitable and losing ones).
The choice of the Stochastic Indicator period depends on the trading system within which it is used. If a trader relies solely on the Stochastic Indicator, selecting longer periods is preferable. If the Stochastic Indicator is used in conjunction with trend indicators to make trading decisions, smaller periods can be used, but positions should only be opened in the direction of the current long-term trend (determined by the trend indicator).
Part II. Technical Analysis / Chapter 26. Williams Percent Range
In this chapter, we will discuss the Williams Percent Range indicator (%R) as another oscillator of Forex technical analysis. In terms of construction, this indicator is similar to the Stochastic indicator we have already discussed, as they have a very similar calculation formula.
The Williams Percent Range is a simple yet effective oscillator that is named after its creator, Larry Williams. This indicator was developed in 1973 and has since been successfully used by traders worldwide to forecast price changes in various financial assets across different financial markets, including the Forex market. The Williams Percent Range shows the position of the closing price of the current trading period relative to the price range (the difference between the highest and lowest prices) over a certain period of time in the past. The commonly used formula for calculating this oscillator is as follows:
%R = -1 * (H(n) – C(i)) / (H(n) – (L(n)) * 100,
where C(i) is the closing price of the current trading period (candle), L(n) is the lowest price over the last n periods, H(n) is the highest price over the last n periods, and n is the calculation period of the indicator. The value of n is typically set to 14 in technical analysis software programs. It is worth noting that the formula above bears many similarities to the calculation formula of the Stochastic oscillator. The difference lies in the fact that the Stochastic oscillator considers the difference between the current closing price and the minimum of the trading range, while the Williams Percent Range takes into account the difference between the maximum price of the trading range and the closing price. The -1 in the calculation formula is used to preserve the geometric interpretation of the overbought zone (which should be at the top) and the oversold zone (which should be at the bottom). The Williams Percent Range is illustrated in the following figure.
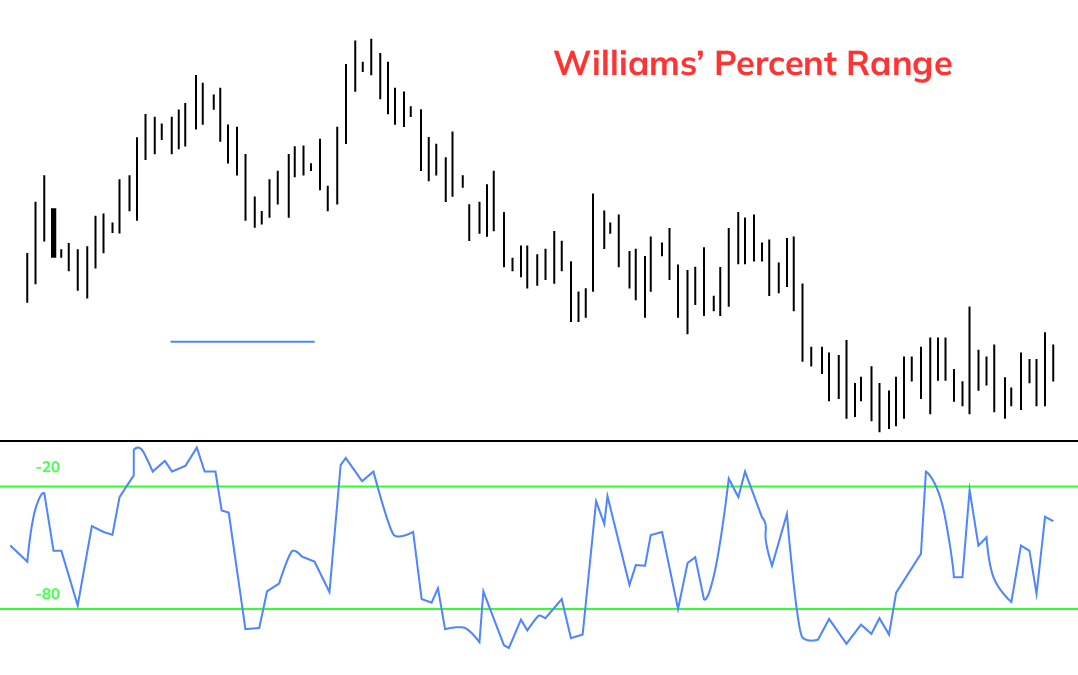
As seen from the figure, the indicator we are examining also has its range of acceptable fluctuations and significant levels. The Williams Percent Range always ranges from 0 to -100. The -20 level defines the overbought zone (above the level value), while the -80 level defines the oversold zone (below the level value). It can be observed that, unlike the Stochastic indicator, the Williams Percent Range is a fast oscillator (no moving averages are applied for smoothing), and it reacts to any minor price fluctuations or noise.
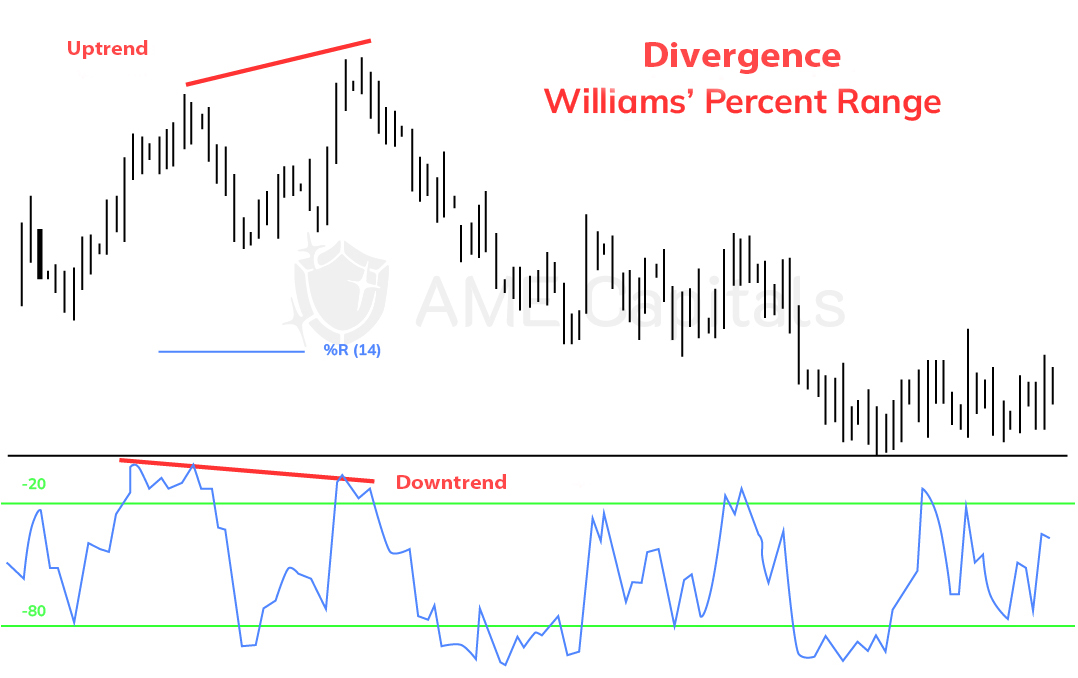
Being a classical oscillator, the Williams Percent Range provides key signals during divergence, which refers to the divergence in the behavior of the price chart and the indicator chart. Divergence has already been discussed in detail in previous chapters as a mechanism. The following figure illustrates a bearish divergence, where the rise in asset prices is not confirmed by an increase in the oscillator chart, indicating a weakening of bull strength and a potential reversal of the bull trend or at least a likely bearish correction. Historical data shows that the market behaved exactly as predicted by the oscillator.
Like other oscillators, the Williams Percent Range should be used with caution in trending markets because in an established trend, it can generate many false trading signals if the entry into overbought and oversold zones is considered as trading criteria. The indicator provides relatively reliable signals in relation to these zones only when the price is in a horizontal range (a flat) and is about to break out of it, indicating the formation of a new trend.
As you can see, the Williams Percent Range doesn't differ much from other oscillators in terms of generating trading signals in Forex market technical analysis. If we compare it to the Stochastic indicator, in a sense, it is a subset of the Stochastic indicator. If a beginner trader has a choice, it is better to use the Stochastic indicator for Forex market technical analysis as it offers more flexibility in settings and is naturally slower, thereby providing fewer false trading signals.
Part II. Technical Analysis / Chapter 27. Relative Strength Index
In this chapter, we will discuss another oscillator called the Relative Strength Index (RSI), which is a favored tool among many traders. The RSI indicator was invented by J. Welles Wilder Jr. and was first described in an article in the \"Commodities\" magazine in 1979 (now known as \"Futures\" magazine). A detailed explanation of the RSI indicator can be found in the author's book "New Concepts in Technical Trading Systems.\"
It's worth noting that the name of the indicator is not entirely appropriate. Among the tools of technical analysis, the term "relative" is usually used when analyzing multiple financial instruments, where one instrument is analyzed relative to another. In the concept of the RSI indicator, however, the internal strength of a single financial instrument is analyzed. Nevertheless, the name "Relative Strength Index" has firmly established itself in the trader community and continues to be used to this day.
The RSI indicator compares the absolute magnitude of market gains over a specific time interval to the absolute magnitude of market losses, and represents this ratio as a number ranging from 0 to 100 through simple transformations. The RSI indicator has a single parameter called the period, which determines the length of the time interval used in the calculation. The default period for the RSI indicator is 14, but other periods such as 8 or 25 are also commonly used. For example, if we are analyzing the daily chart of a currency pair in the Forex market and using a period value of 14, we would consider the past 14 days. The closing price of each day is analyzed in relation to the previous day's closing price.
The general formula for calculating the RSI indicator with a period of n can be summarized as follows:
- Gather the closing prices for the current day and the past n days;
- Identify the days when the market closed above the previous day's level, calculate the cumulative absolute value of those gains, and divide it by the period n to obtain the average gain (sometimes an exponential moving average is used for smoothing purposes);
- Identify the days when the market closed below the previous day's level, calculate the cumulative absolute value of those losses, and divide it by the period n to obtain the average loss (sometimes an exponential moving average is used for smoothing purposes).
- Calculate the relative strength (RS) by dividing the average gain by the average loss. This relative strength value forms the basis of the RSI indicator.
- For ease of display and analysis, the RS value is transformed using a simple formula so that RSI values range from 0 to 100;
- Repeat the process for each new period (candle) that forms, shifting the analyzed price range to the right with the arrival of new prices.
The magnitude of the period determines the future shape of the RSI indicator curve. Smaller values result in a faster curve that reacts even to minor price noise. Larger values lead to a slower curve that filters out price fluctuations but also makes the RSI indicator less sensitive in generating timely trading signals. The formula for calculating the Relative Strength Index (RSI) is as follows:
RSI = 100 – (100 / (1 + A(n) / B(n))),
where A(n) represents the absolute value of the average positive change over the last n periods, and B(n) represents the absolute value of the average negative change over the last n periods.
To better understand the construction principle of the RSI indicator, let's consider the following sequence of daily closing prices for an abstract financial instrument: 2, 6, 4, 8, 6, 11, 12, 7, 6, 5, 2, 5, 8, 15, 12. Let's calculate the Relative Strength Index for the current trading day (with the latest price being 12), considering a period of 14 (analyzing the last 14 price changes).
By subtracting each subsequent price value from its previous value, we obtain the following sequence of changes: 4, -2, 4, -2, 5, 1, -5, -1, -1, -3, 3, 3, 7, -3. We calculate the sum of the absolute values of positive changes: 4 + 4 + 5 + 1 + 3 + 3 + 7 = 27. We calculate the sum of the absolute values of negative changes: 2 + 2 + 5 + 1 + 1 + 3 + 3 = 17. We find the Relative Strength using the formula RS = 27 / 17 = 1.5882, and we substitute this value into the RSI formula: RSI = 100 - (100 / (1 + 1.5882)) = 61.36.
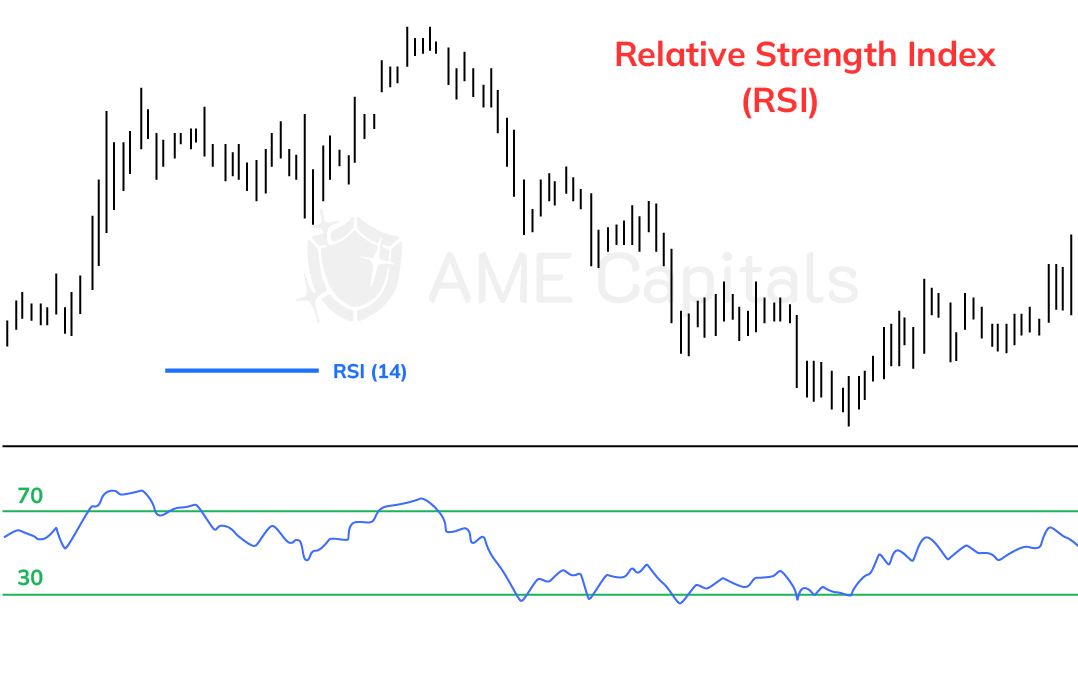
With the closing of each new day (candle), the analyzed price range shifts to the right, and the calculations are repeated with new data. The next figure illustrates an example of plotting the RSI indicator on a chart.
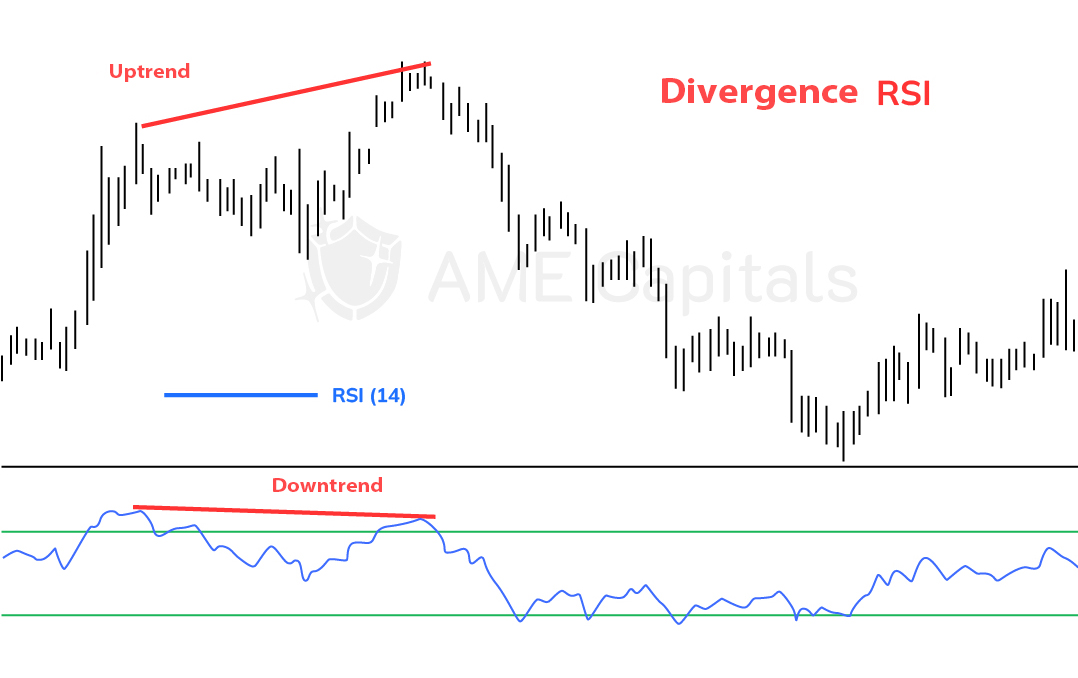
Technical analysis using the RSI indicator is practically no different from using other oscillators we have discussed. The main trading signal is still divergence - a divergence in the behavior of the price of a financial instrument and the Relative Strength Index. If the price makes two higher highs while the RSI indicator shows lower highs, it indicates a weakening of bullish strength and a possible reversal or correction of the bullish trend downwards. The same principle applies in the opposite direction for a bearish market. An example of price divergence with the RSI chart is shown in the following figure.
The significant levels of the RSI indicator are 30 and 70. The first level marks the oversold zone, while the second level marks the overbought zone. In his book mentioned at the beginning of the chapter, J. Welles Wilder describes several ways to apply the RSI indicator for analyzing financial markets, including the forex market.
The first method involves analyzing the peaks and troughs of the RSI indicator. Peaks are usually formed above the significant level of 70, while troughs are formed below the significant level of 30 and precede the corresponding price extremes (highs and lows of the financial instrument's price chart).
The second method involves analyzing chart patterns on the RSI chart. Quite often, technical analysis patterns such as triangles, flags, head and shoulders, etc., are formed on the RSI chart, even if they may not appear on the price chart. The interpretation of these chart patterns on the RSI chart is similar to their interpretation on the price chart.
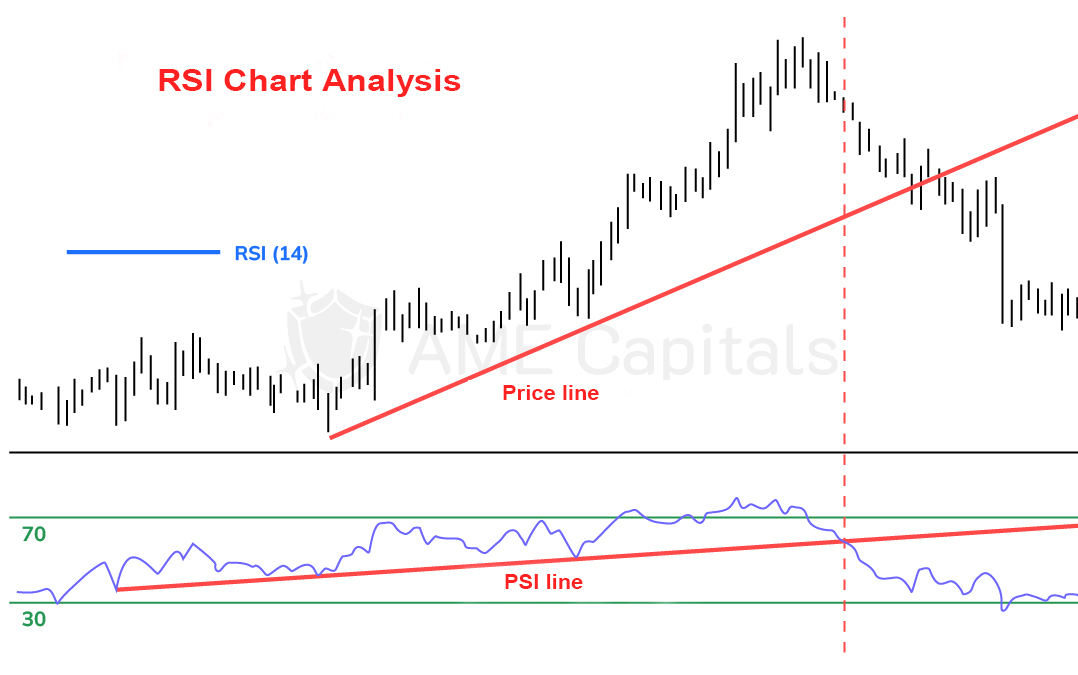
The third method involves analyzing support and resistance levels and trendlines on the RSI chart. These levels are often more pronounced on the RSI chart than on the price chart. The interpretation of support and resistance levels and trendlines is the same as their classical interpretation when analyzing the price chart. A breakout or bounce from these levels can provide good trading signals. The following figure shows a situation where the breakout of the RSI support line occurred before the breakout of the price chart's support line, signaling a potential trend reversal.
In addition to the methods described above, the RSI indicator can be analyzed in relation to its position relative to the center line (value of 50). If the RSI chart is above the center line, it indicates a bullish sentiment prevailing in the market. If the RSI chart is below the center line, it indicates a bearish sentiment dominating the market. When the RSI indicator oscillates around the center line, it suggests that prices are in a horizontal range or consolidation phase.
Similar to other oscillators used in forex market technical analysis, when receiving trading signals, attention can be given to the crossing of the RSI chart with its significant levels (30 and 70). However, such crossovers should be considered seriously either when prices exit a horizontal range or during the dominant long-term trend (opening buy positions only in a bullish market and sell positions only in a bearish market).