- AME CAPITALS
- Trading Technology
- Help AME Trading
Part II. Technical Analysis / Chapter 3. Price, Trading Volume, and Open Interest
In the previous chapter, we learned that price is not the sole factor to consider when analyzing the Forex market. In addition to the currency price itself, trading volume plays a significant role. As stated in one of the postulates of Dow Theory, a trend is confirmed by trading volume. However, it is challenging to determine the trading volume in monetary terms for a specific trading period in the Forex market. The Forex market does not have a centralized trading location, and currency exchange takes place through the banking network worldwide, making it difficult to calculate the total amount of bought or sold currency. To approximate the trading volume, one can utilize data from futures exchanges regarding the buying and selling of currency futures contracts since the futures market has a strong correlation with the Forex market for such contracts. However, obtaining even an approximate monetary value of trading volume in the Forex market would require considering multiple futures exchanges, which is also problematic. Therefore, a different approach is used to assess trading volume in the Forex market, which we will explore in this chapter.
In reality, it is not entirely correct to rely on the monetary trading volume in the Forex market when making decisions on opening or closing positions. In such cases, a few large funds with billions of capital can create an illusion of market interest in a particular currency through their speculative operations in the Forex market. Therefore, it is more appropriate to analyze the number of transactions executed with a currency during the given trading period rather than the monetary trading volume. To approximate this indicator in the Forex market, the number of quotes from market makers is used. Typically, only the changing quotes are considered from the total volume of issued quotes. The more frequently the quotes change, the more it confirms the market's interest in maintaining the current trend.
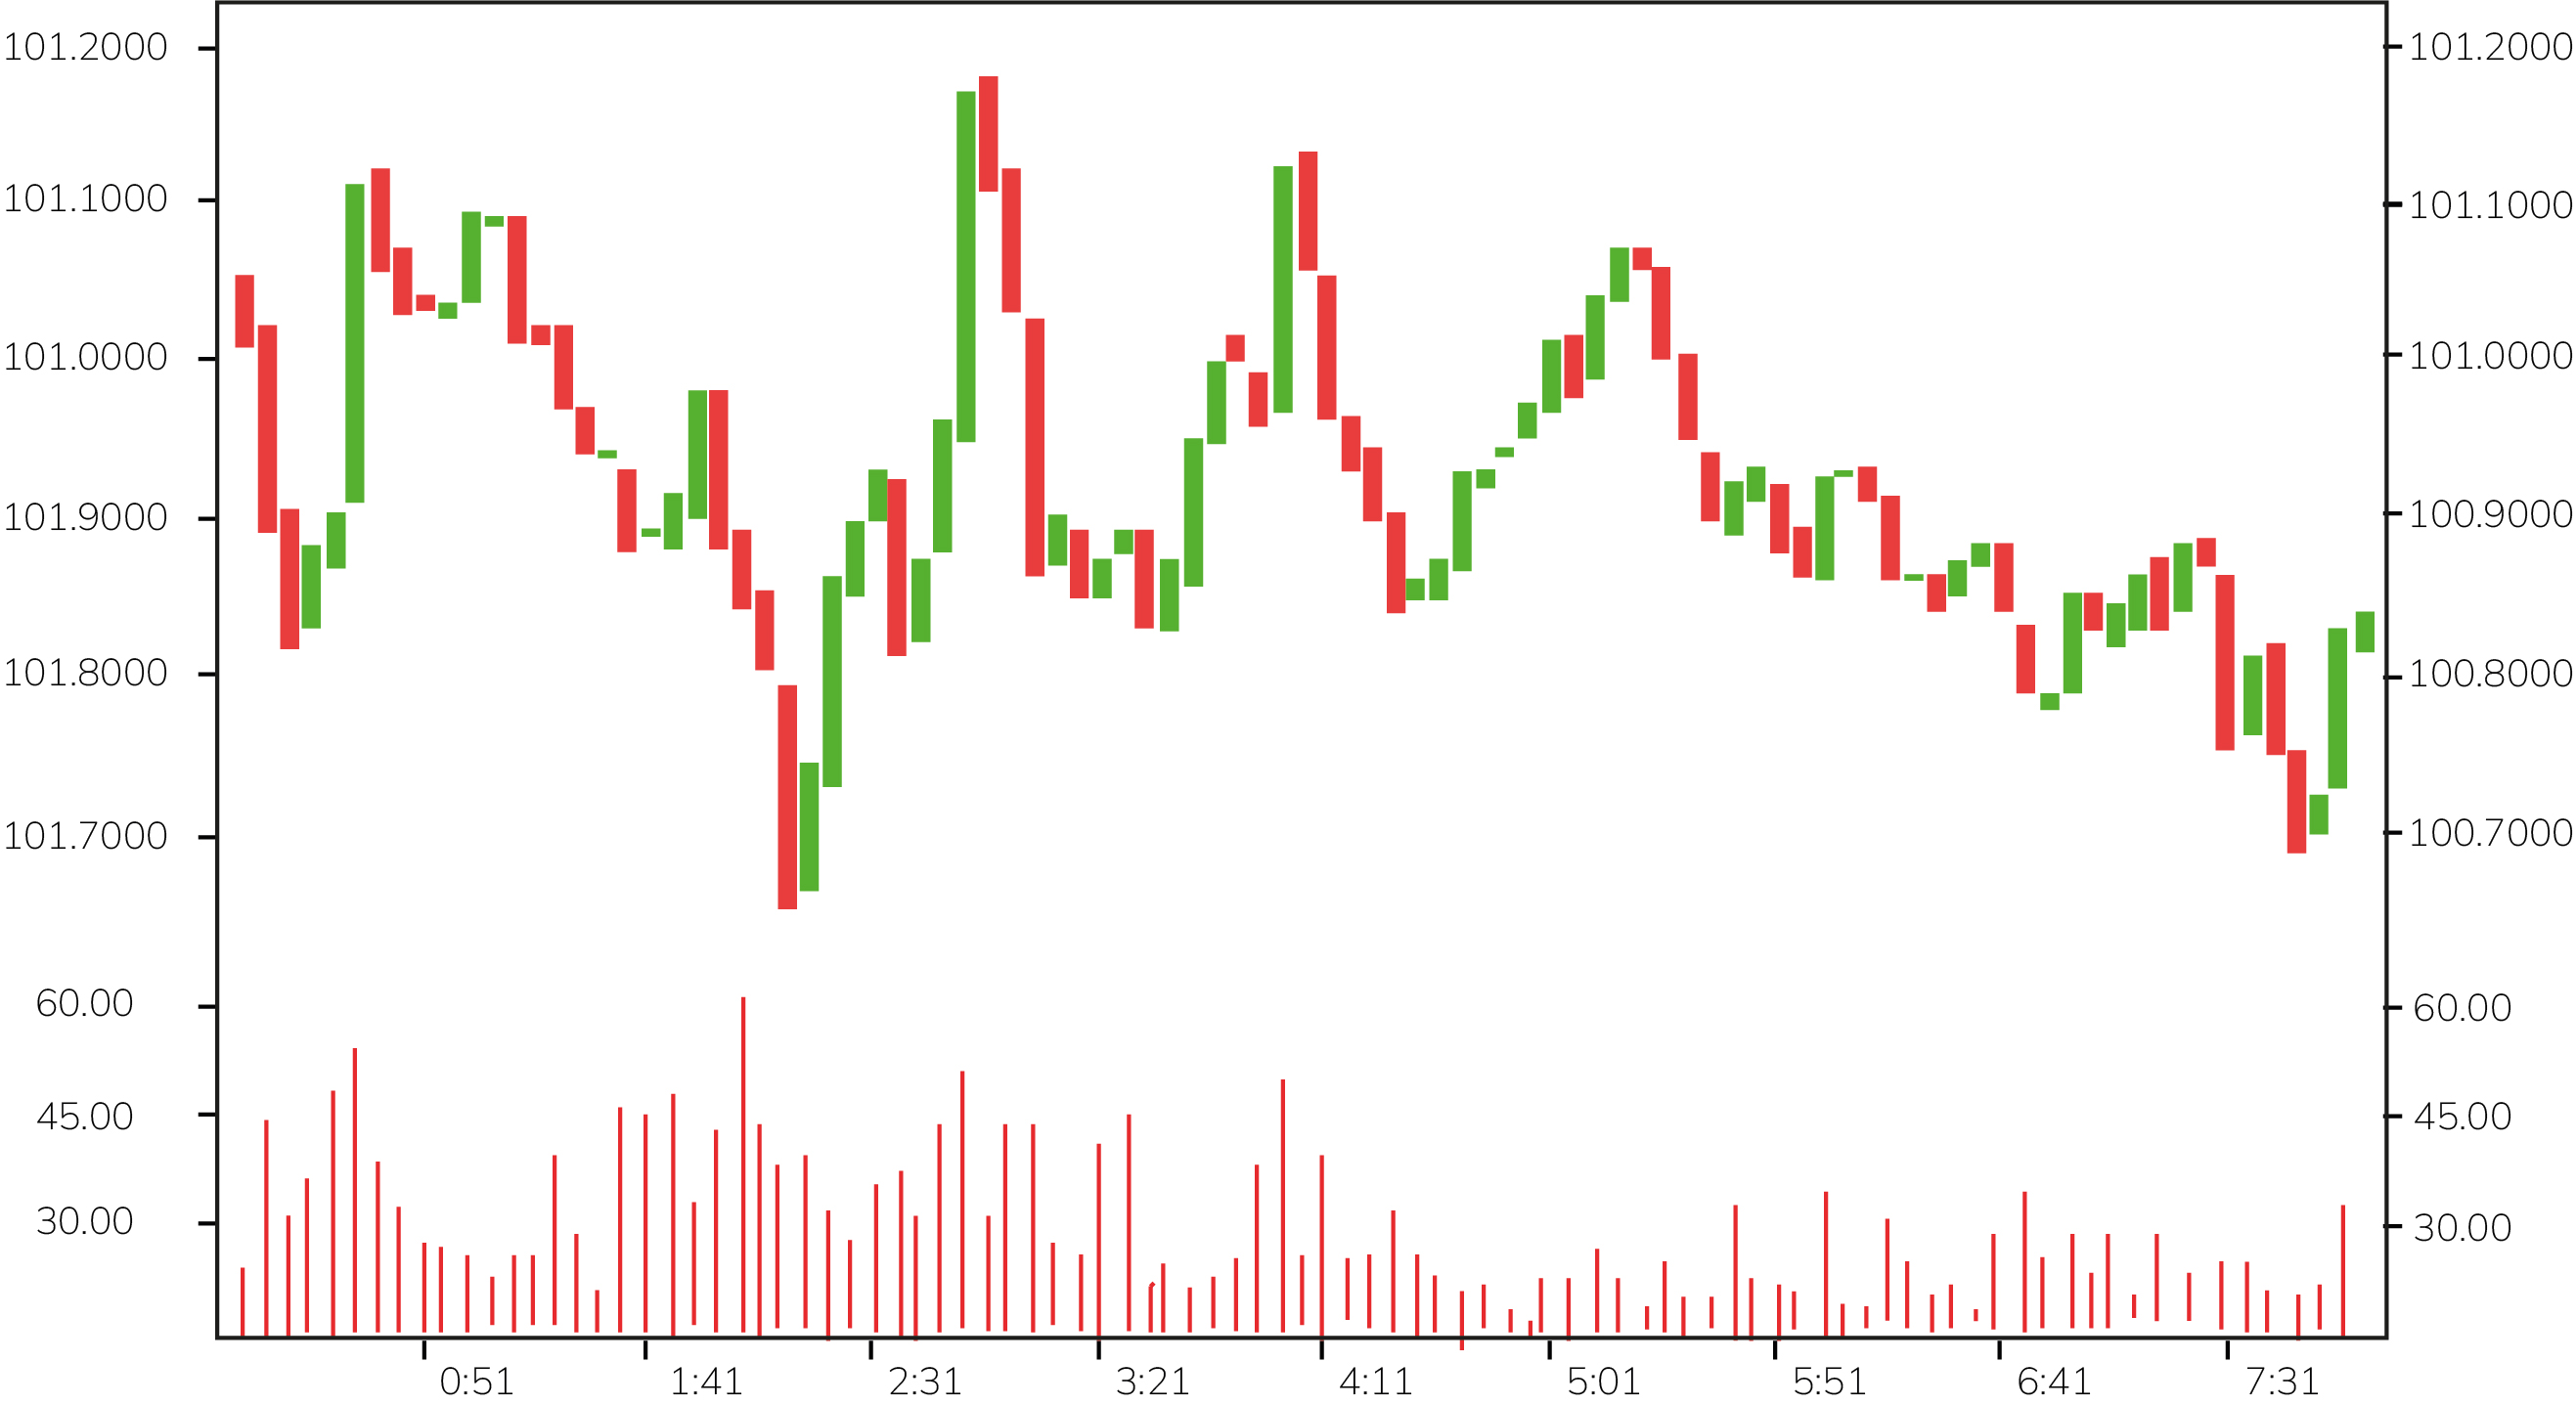
So, in technical analysis of the Forex market, the trading volume is considered as the rate of change of quotes by market makers during the given trading period. Trading volume is the second most important factor (after price) analyzed by traders. To analyze the trading volume, a special chart called a trading volume histogram is constructed. The histogram consists of bars of varying heights. Each bar corresponds to a specific trading period, depending on the chosen time scale (1 minute, 5 minutes, 15 minutes, etc.). The height of each bar represents the trading volume value - the higher the bar, the faster the rate of quote updates by market makers. Histograms are usually plotted beneath price charts. In this case, each histogram bar corresponds to a single chart pattern (bar or candle) and represents the trading volume for the specific period represented by that pattern. A Japanese candlestick chart with a trading volume histogram overlaid on it, using the example of USD/JPY, is shown in the figure.

Volume histograms do not provide information about the activity of "bulls" and "bears," meaning it is not possible to determine whether there were more buying or selling transactions during a trading period. However, such information is redundant since market preferences can be determined from the price chart. It is worth noting that trading volumes usually precede price movements because prices are more inertial than volumes. If price increases occur with increasing volumes and then the volume decreases, the price usually continues to rise for some time due to inertia before eventually declining. Thus, changes in volumes can be a good signal of weakening or reversal of a trend, and they should not be neglected when analyzing the forex market. Always plot volume histograms beneath price charts in your forex analysis. Volumes are most significant when analyzing daily and weekly charts.
On financial markets, open interest, the number of outstanding (unclosed) contracts at the end of a trading period, is the third most important indicator analyzed after price and trading volume. The significance lies not in the absolute value of this indicator but in its fluctuations, specifically increases and decreases. An increase in open interest can serve as a good indicator of long-term trader preferences. If a position is not being closed, it indicates that the trader supports the existing trend in the long term. However, excessively large increases in open interest can signal a trend reversal, as traders may soon start closing their positions to lock in profits.
The chart of open interest is usually plotted between the trading volume histogram and the price chart. However, it is not used in the Forex market since there is no fixed trading location on Forex, making it impossible to track open interest.
To summarize this chapter, let's once again emphasize one of the postulates of Dow theory: volumes should confirm the trend. In an upward or downward trend, price movements in the direction of the main trend occur on increasing volumes, while movements against the trend occur on decreasing volumes. Always plot a volume histogram on the price chart when analyzing and forecasting the Forex market.


