


- AME CAPITALS
- Trading Technology
- Help AME Trading
Part II. Technical Analysis / Chapter 5. Trend Reversal Patterns
In technical analysis of currency price charts in Forex, the primary task of every trader is to determine the trend and identify signals of its confirmation or reversal. In this chapter, we will discuss trend reversal patterns.
Determining chart patterns is not an exact science but rather a subjective interpretation of each trader. However, as we have mentioned before, to be a successful trader, you need to think like the majority. Only then can you increase your profits and reduce your losses. Identifying chart patterns in currency price charts in Forex can be compared to observing clouds and finding mysterious shapes in the sky. People can look at the same cloud and see different shapes because they are a product of the observer's imagination. The situation with chart patterns is similar because such charts do not have strict forms, and they can be interpreted differently. Nevertheless, there are several patterns that can serve as a signal of a trend reversal with a certain degree of probability. Most traders are aware of such patterns. Therefore, the more a section of the chart resembles a reversal pattern, the more traders will believe that a trend reversal is approaching. The more traders believe in it, the more likely it is to happen. If the impending reversal signal is also confirmed by other technical analysis indicators, the probability of a trend change increases even further.
Please note that we are not making definitive statements about trend reversal signals, but rather discussing the probability of such an event. Technical analysis in the Forex market is an imperfect process. When we say that a certain pattern on the chart is a reversal pattern, we assume that it has often acted as such in the past. Often, but not always! Historical data can provide exceptions where reversal patterns did not work. Therefore, approach reversal patterns with a certain degree of skepticism and try to diversify your portfolio of technical analysis tools. The more different indicators signal a trend reversal, the more likely such a reversal will occur.
In this chapter, we will discuss six trend reversal patterns:
- Head and Shoulders and Inverse Head and Shoulders
- Double Top and Double Bottom
- Triple Top and Triple Bottom
As you can guess, some of these patterns indicate the formation of a downtrend. These patterns include Head and Shoulders, Double Top, and Triple Top. On the other hand, Inverse Head and Shoulders, Double Bottom, and Triple Bottom are similar to the first three patterns but inverted by 180 degrees, and they symbolize the approach of an uptrend.
It is worth noting that these patterns not only help identify the formation of a new trend but also provide approximate price levels for optimal position exits within that trend. In other words, these patterns offer signals not only for opening positions but also for potential target prices to consider for closing them. However, it's important to remember that these statements are probabilistic and should be approached with caution.
The patterns discussed in this chapter are typically sought after on medium-term and short-term charts. Charts with a daily interval (daily time frame) are considered ideal. On intraday charts (hourly, minute), these patterns are not widely analyzed by traders.
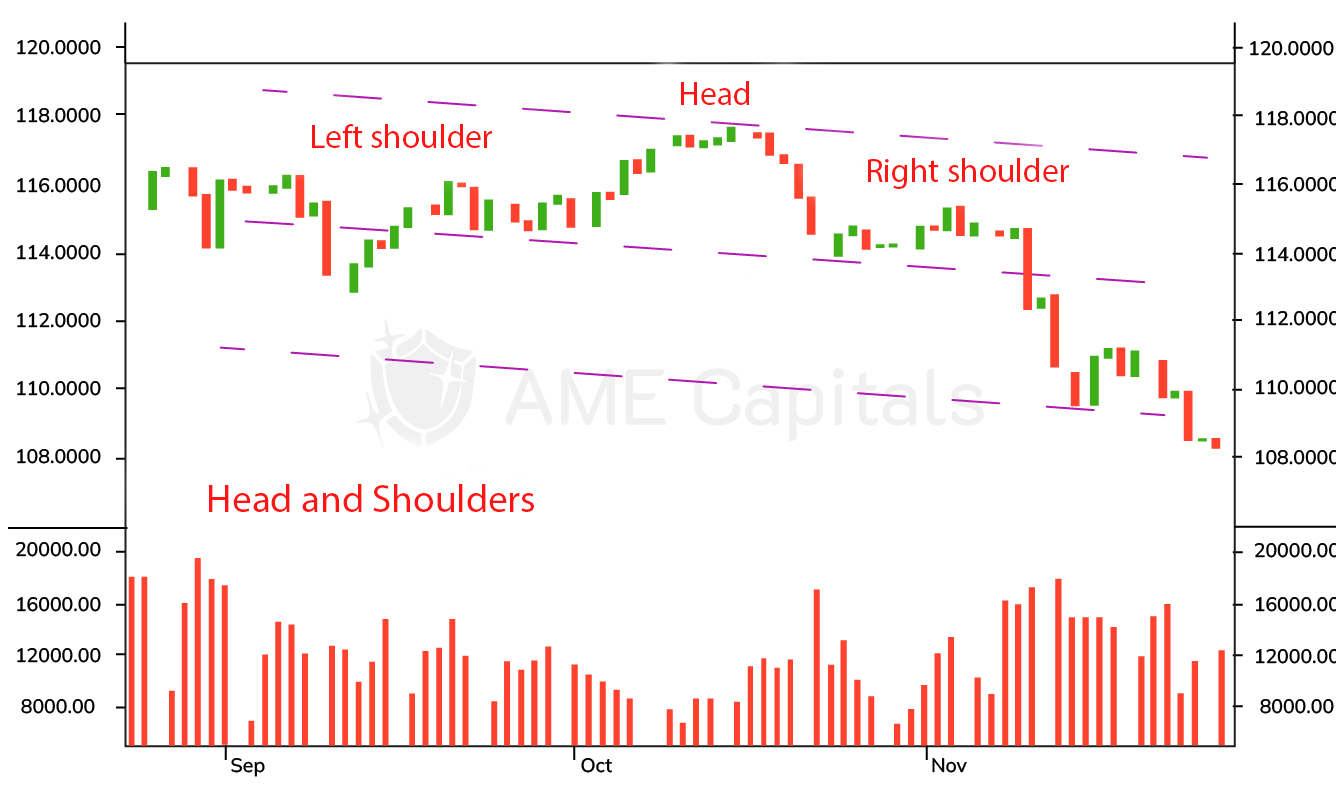
The first pattern we'll discuss is the "head and shoulders" pattern. This pattern consists of three consecutive price peaks, with the middle peak (the head) slightly higher than the two surrounding peaks (the shoulders). The two side oscillations represent the shoulders, while the middle oscillation represents the head. The head and shoulders pattern is shown in the chart example of USD/JPY.
The "neckline" level plays a significant role in this pattern. It is a line that connects the two lows of the pattern. Typically, when the right shoulder breaks below the neckline, the price tends to decline rapidly by a distance equal to the distance from the neckline to the head. This can provide a good forecast for position exits. In the chart, two dashed lines parallel to the neckline are drawn. Both lines are equidistant from the neckline. The upper dashed line passes through the head, while the lower line represents the expected lower boundary that the price should reach after the neckline is breached by the right shoulder. In the given example, the lower dashed line turned out to be a fairly accurate forecast.
When analyzing trend reversal patterns, it is essential to consider charts with volume histograms. If we expect the formation of a downtrend, as in the example above, downward price movements should be accompanied by increasing volumes. This is especially true for the break of the neckline by the right shoulder, which should be accompanied by a sharp increase in volume.
The "inverse head and shoulders" pattern is similar to the head and shoulders pattern, except it is its upside-down counterpart and symbolizes the approach of an uptrend.
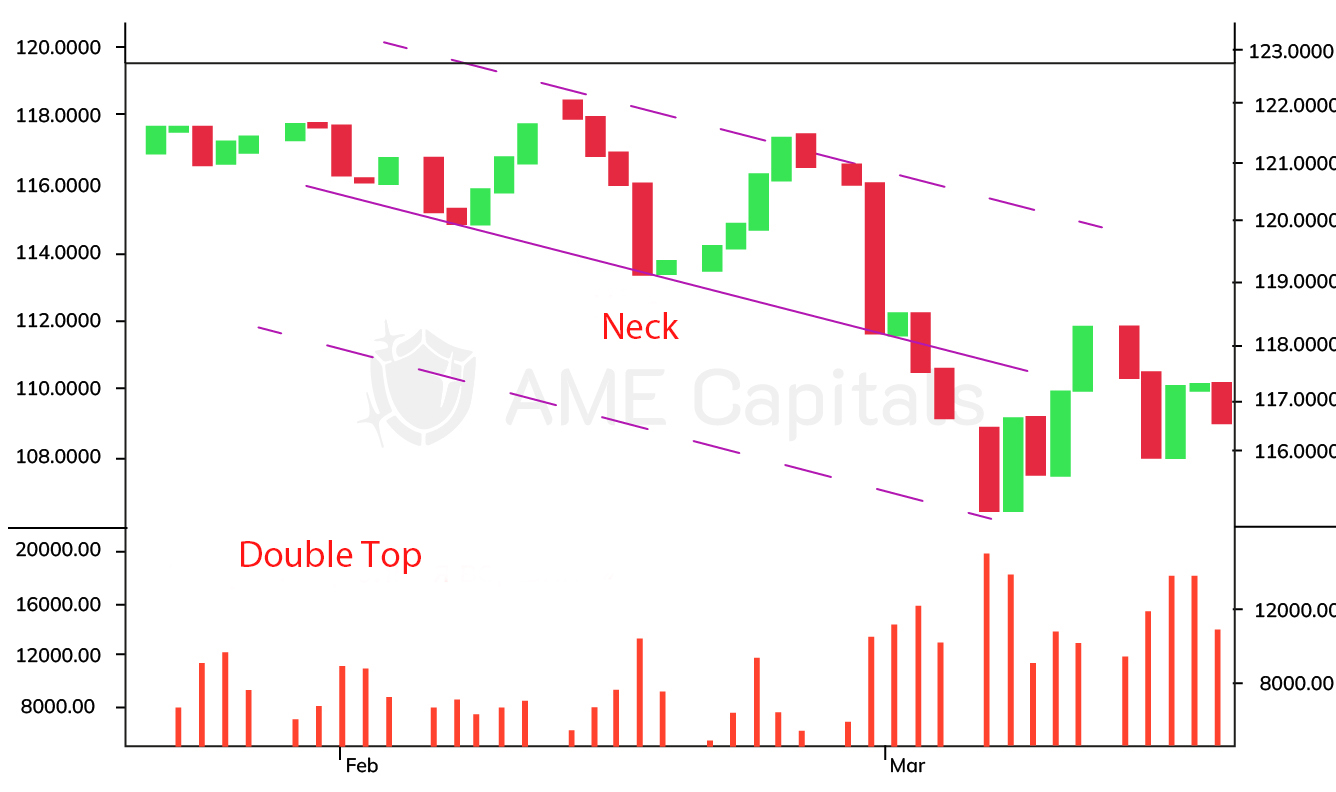
The head and shoulders pattern is a classic pattern. However, more often on charts, we encounter situations where the pattern lacks a "head," and only two oscillations indicate an impending price decline. In such cases, we refer to the "double top" pattern. It also has a neckline, but it is slightly more challenging to determine as it passes through only one trough. Therefore, a parallel line is used to draw the neckline, passing through two peaks. The double top pattern is shown in the chart example of USD/JPY.
The upper dashed line passes through both peaks. The bold line, parallel to it and passing through a local trough, defines the neckline. The lower dashed line is equidistant from the neckline as the upper dashed line and represents the expected price decline after the breakout of the neckline following the completion of the second oscillation. In other words, if the neckline is broken in the double top pattern, the expected price decline is determined by the distance from the neckline to the right peak. It should be noted that the peaks do not necessarily have to be at the same level, and the upper dashed line can be sloping.
Similar to the head and shoulders pattern, downward price movements in the double top pattern should be accompanied by increasing volume. This is especially true for the breakout of the neckline. The double bottom pattern is entirely analogous to the double top pattern, except that it is its upside-down counterpart and symbolizes the approach of an uptrend. .
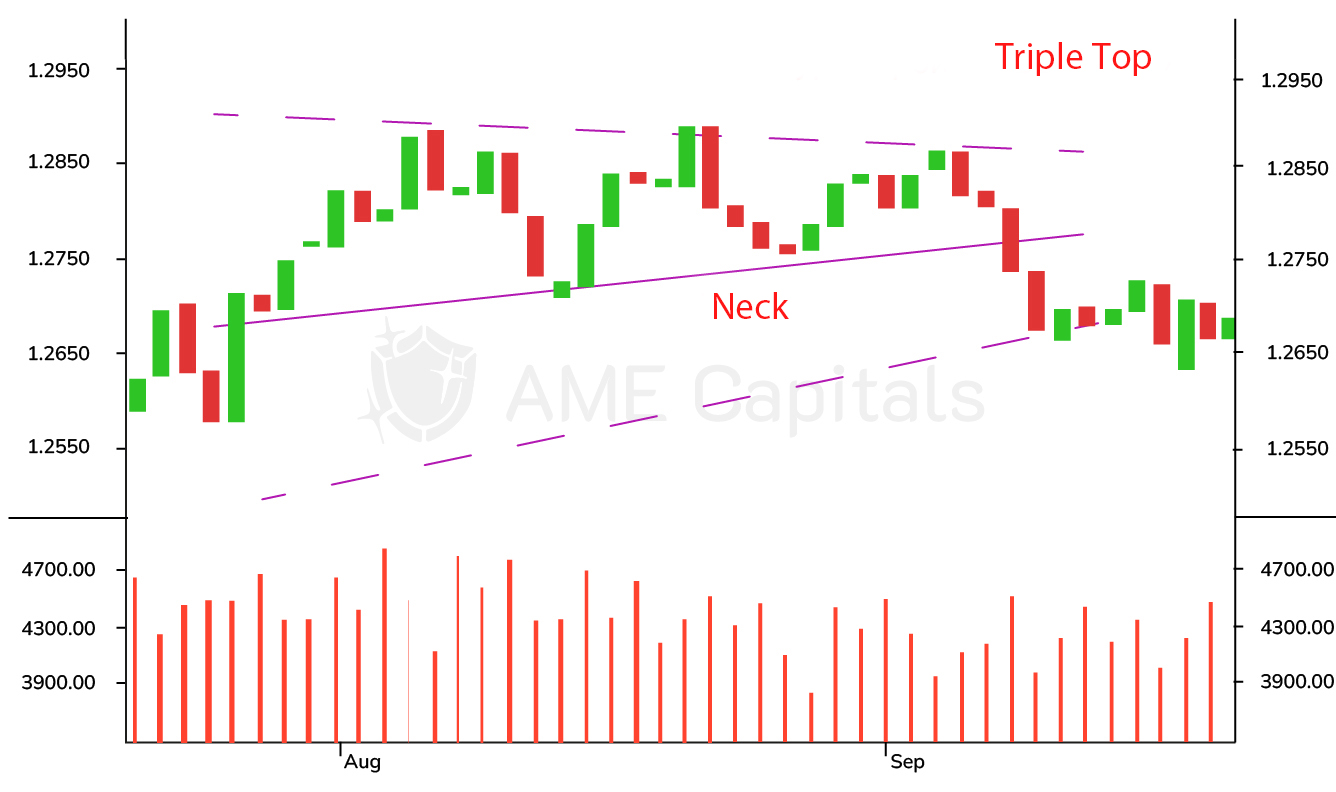
In some cases, the price chart in the forex market may resemble the head and shoulders pattern, but the "head" does not stand out in terms of its level compared to both "shoulders." In such cases, we refer to the triple top pattern, which also signals an imminent trend reversal. The chart example of the triple top pattern is shown for EUR/USD.
The construction principle of the neckline is the same as for the head and shoulders pattern. The expected level of price decline can be determined by the distance from the neckline to the right shoulder. In order to identify such a level, two dashed lines are drawn on the chart, symmetrically positioned with respect to the neckline. It is important to note that the price decline occurs with increasing volume, confirming the formation of a trend.
The triple bottom pattern is entirely analogous to the triple top pattern, except that it is its upside-down counterpart and symbolizes the approach of an uptrend.
We have examined three types of trend reversal patterns. In this context, a trend reversal can also refer to the formation of a new trend or an expected price change in the future. Trend reversal patterns not only signal an upcoming reversal but also, with a certain probability, indicate the level to which the price may fall or rise. These patterns must be confirmed by changes in the volume histogram. It should be noted that history has seen many cases where the patterns discussed in this chapter appeared on Forex price charts but did not lead to the expected price change. Therefore, approach such patterns with a certain level of skepticism and always seek confirmation of your expectations for trend changes from other technical analysis indicators. The more indicators that indicate the formation of a new trend, the more likely it is to occur.