


- AME CAPITALS
- Trading Technology
- Help AME Trading
Part II. Technical Analysis / Chapter 4. Support, Resistance, and Types of Trends
The primary task of technical analysis in financial markets, including the foreign exchange (Forex) market, is to identify trends on the constructed chart. According to Dow Theory, three types of trends can be distinguished: long-term, intermediate-term, and short-term. The type of trend depends on the time frame of the chart being analyzed. If we analyze a monthly chart and identify a trend, we refer to it as a long-term trend. If we analyze weekly or daily charts, we refer to it as an intermediate-term trend. If we analyze hourly or minute charts, we refer to it as a short-term trend.
Each trend, regardless of its type, can be either an uptrend (rising or bullish trend) or a downtrend (falling or bearish trend). The market can also exhibit a sideways trend when the forces of bulls and bears are balanced over a certain period of time, and the price lacks a dominant upward or downward movement.
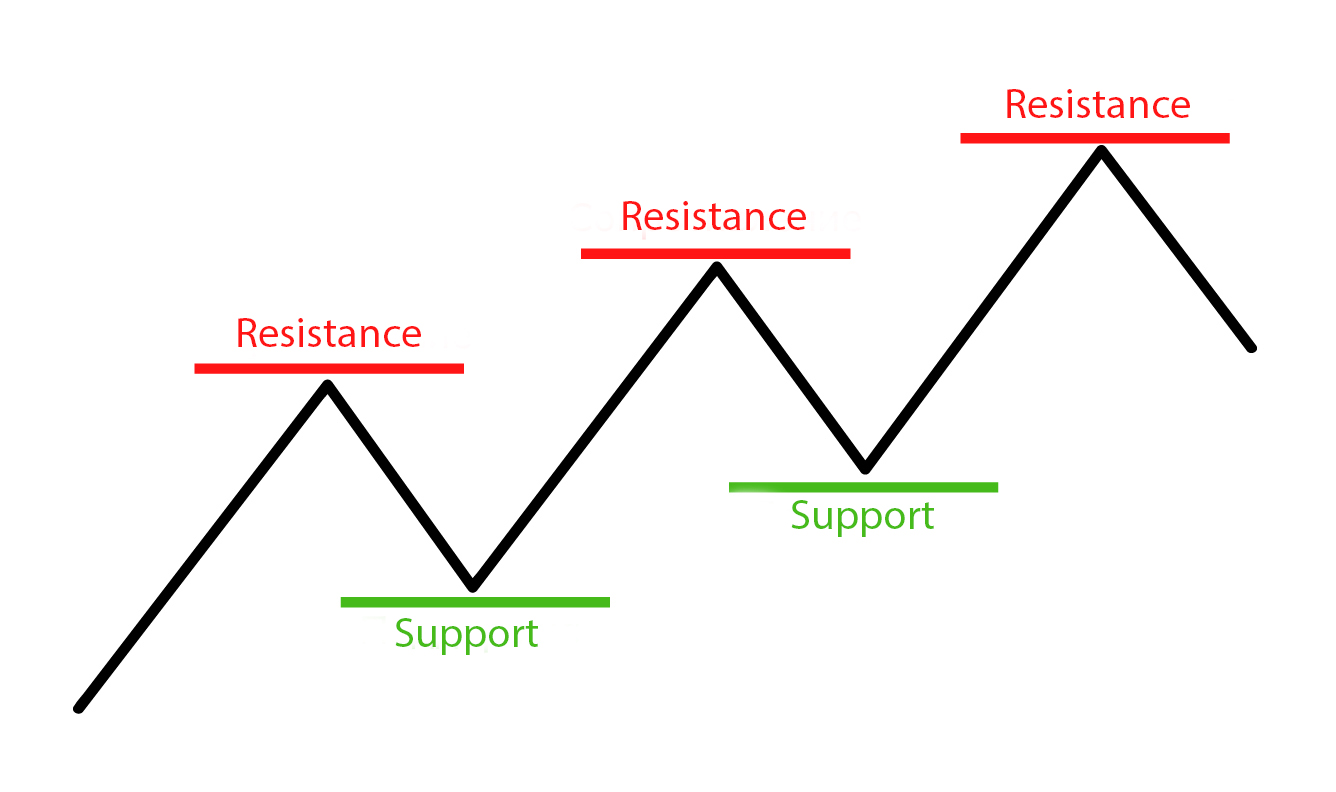
The price of a currency in the Forex market is constantly changing, undergoing wave-like oscillations. On such a chart of wave-like oscillations, it is always possible to identify local lows and highs. The value of the price at a local low determines a horizontal line called a support level. The value of the price at a local high determines a horizontal line called a resistance level. This concept is illustrated in the diagram.
Support and resistance levels hold great significance in the technical analysis of the Forex market. The more frequently the price returns to a particular level, the more significance that level holds for the market. This can be explained by the psychology of traders, who attach more importance to a level if it is repeatedly confirmed by price returning to it over time. Often, when a support level is breached, it becomes a new resistance level, and similarly, when a resistance level is broken, it becomes a new support level. The diagram illustrates the USD/JPY price chart with support and resistance levels plotted on it.
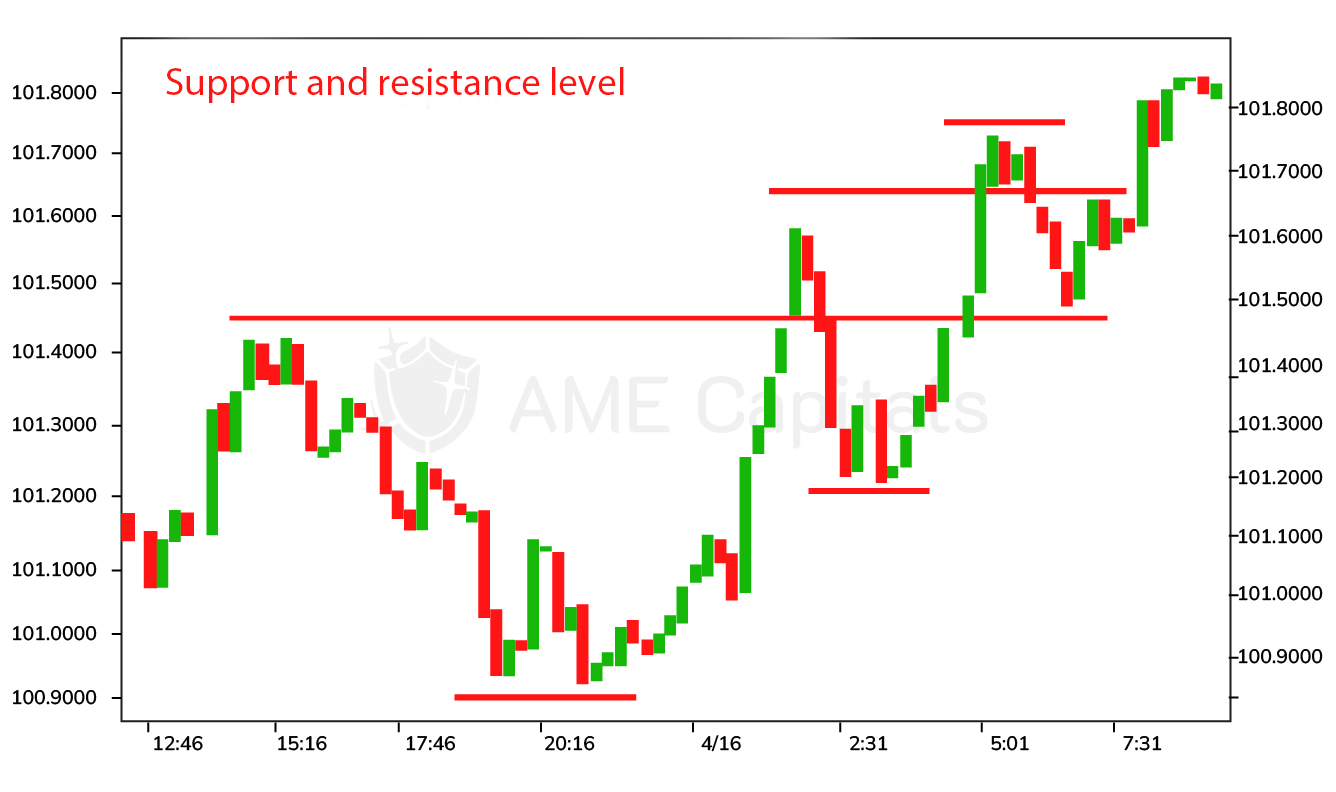
The first level from the bottom is a support level and has been confirmed twice by the market. The same can be said for the second level from the bottom. Note that the third level from the bottom serves as a resistance level at different points in time and later becomes a support level. The fourth level from the bottom is a resistance level and has also been confirmed twice by the market.
It is important to understand that support and resistance levels are not exact values, and their determination involves some degree of subjectivity. Each trader determines their own criteria for identifying these levels. It is generally considered that a level is breached when the closing price of a trading period surpasses it. However, historical forex price data often shows examples where the closing price broke a level but subsequently returned to it in the following trading periods. Therefore, the mere breaking of a level is not a signal to buy or sell. It is necessary to consider other tools of technical analysis that also provide signals for buying or selling. To engage in successful forex trading, it is crucial to use a combination of technical analysis tools.
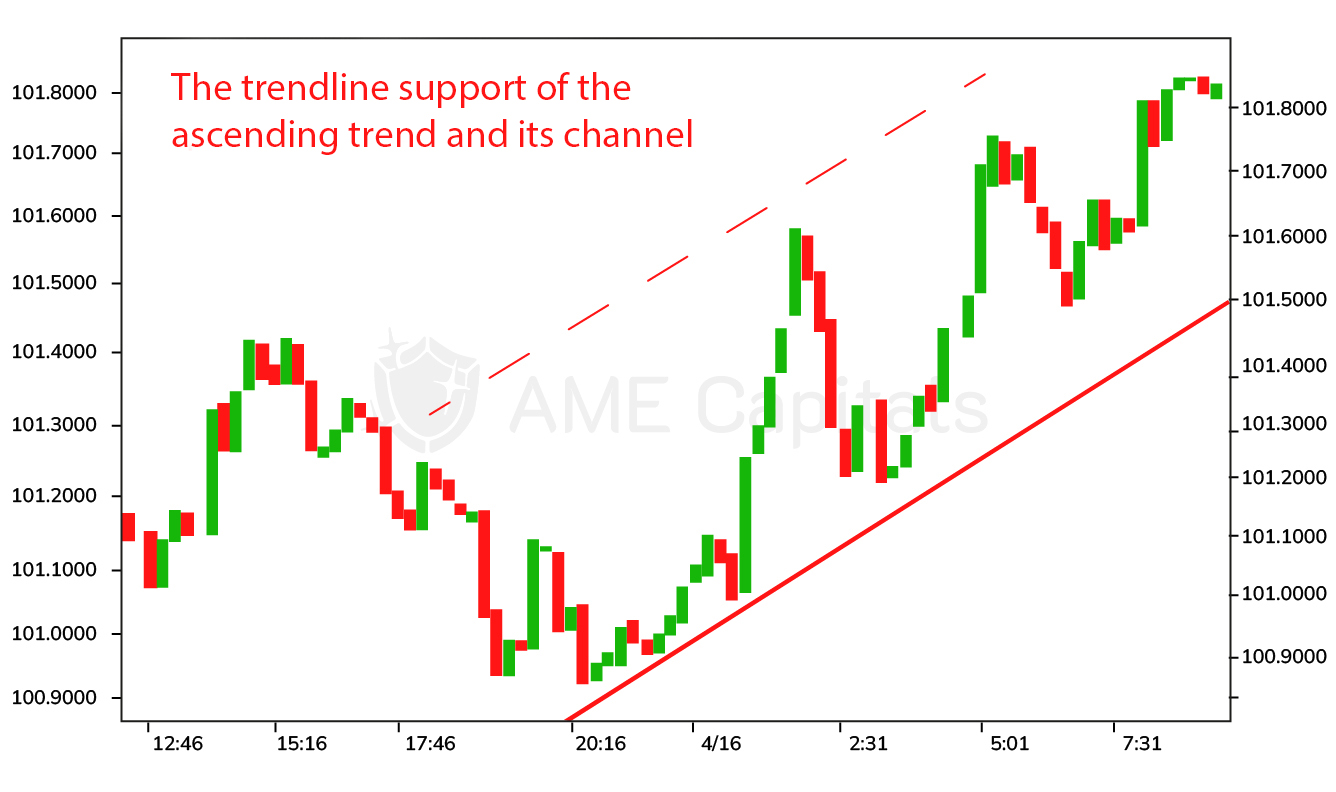
If you connect two consecutive low points on a chart (points that correspond to support levels) and create a line with a positive slope (directed from the bottom left to the top right of the chart), that line is called an ascending support line. If subsequent low points also align with this line, the support line becomes more significant for the market. The more low points are in close proximity to the support line, the more likely that subsequent low points will also be near this line. In the example of the USD/JPY currency pair shown in the figure, the bold line represents the support line.
The support line essentially defines an ascending trend. Its breakout can indicate a trend reversal and carries much greater significance than the breakout of individual support levels. Remember the widely used saying in English literature, "the trend is your friend." Being able to identify trend reversals in a timely manner is the key to successful trading in the Forex market or any other financial market.
In addition to the concept of a trend, technical analysis widely uses the concept of a channel. A channel is a corridor within which the price fluctuates. To determine an ascending channel, another line is drawn parallel to the support line through the highest point of the chart. Both of these lines (the support line and its parallel line) define an upward channel. In the above figure, the parallel line is shown as dashed. It can be observed that the price oscillates within the channel. To profit in Forex, it is necessary to buy currency at the lower boundary of the channel and sell currency at the upper boundary. However, caution is required because when approaching the channel boundary, the price may not rebound but instead break through the corresponding line. In such cases, the trend changes in the opposite direction, and you may incur losses. Therefore, besides defining the channel itself, it is important to use other technical analysis tools that provide signals of confirmation or trend reversal.
Similarly, with a downtrend, the process is similar. If we connect two consecutive points of resistance on the chart (points that correspond to resistance levels) and obtain a line with a negative tangent of the slope (directed from the top left to the bottom right of the chart), such a line is called a resistance line of a downtrend. The resistance line essentially defines a downtrend. If a line is drawn parallel to the resistance line through the minimum point on the chart, both of these lines define a descending channel. In the figure provided, the bold line represents the resistance line on the USD/JPY quote chart. Together with its parallel dashed line passing through the minimum point on the chart, they form a descending channel.
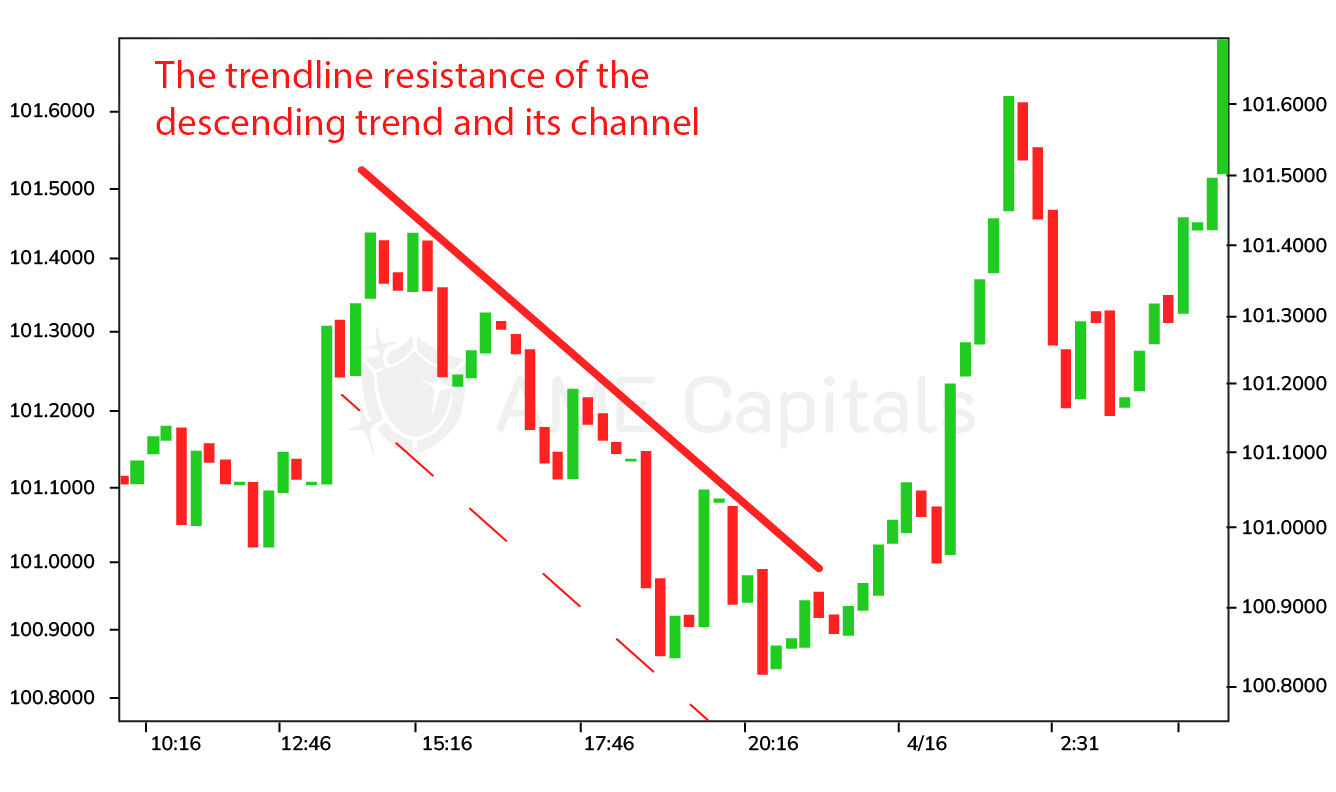
The figure shows that the price approached the resistance line several times and bounced off it, confirming the established downtrend. Trading within a descending channel follows a similar approach to trading within an ascending channel – it involves buying the currency at the lower boundary of the channel and selling the currency at the upper boundary. It's important to understand that any downtrend will eventually reverse, so it's crucial not to miss the trend reversal signal. Confirmation and reversal signals will be discussed in subsequent chapters.
As mentioned earlier, the market can also experience a situation of no clear trend. In such cases, the price oscillates without the ability to identify an ascending trend's support line or a descending trend's resistance line. This situation is represented on the chart as a sideways channel, depicted by two parallel horizontal lines within which the price fluctuates. The sideways channel is illustrated in the figure using the example of USD/JPY currency pair.
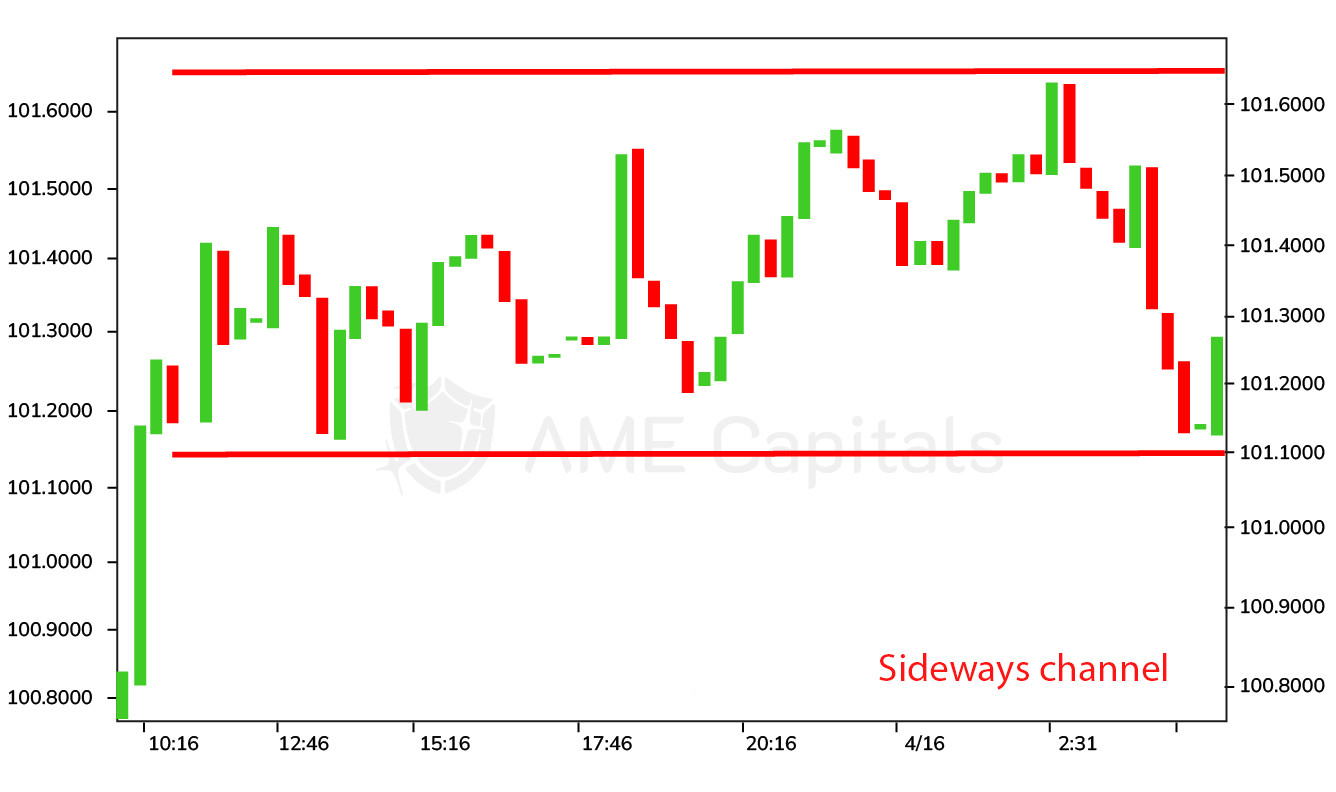
Trading within a sideways channel is undesirable as a well-defined trend has not yet formed, and it is easy to open a position in the wrong direction, resulting in potential losses. The sideways channel can be understood as a balance between the forces of bulls and bears. Typically, the longer this balance persists, the stronger the subsequent price breakout in either direction, leading to the formation of an ascending or descending trend. Sideways channels are often observed on hourly charts during weekends and holidays when trading activity in the Forex market is minimal.