


- AME CAPITALS
- Trading Technology
- Help AME Trading
Part II. Technical Analysis / Chapter 6. Trend Continuation Patterns
In addition to trend reversal patterns, there are trend continuation patterns on Forex price charts in technical analysis. Continuation patterns indicate a temporary correction within the main trend in the opposite direction. Timely identification of such patterns on the charts can help avoid opening positions in the losing direction. In this chapter, we will discuss the following trend continuation patterns:
- «Triangles»;
- «Flags»;
- «Pennants».
All these patterns are defined by two lines: a support line, drawn through local chart lows, and a resistance line, drawn through local chart highs. The more local lows and highs align with the support and resistance lines, the more pronounced the specific pattern is.
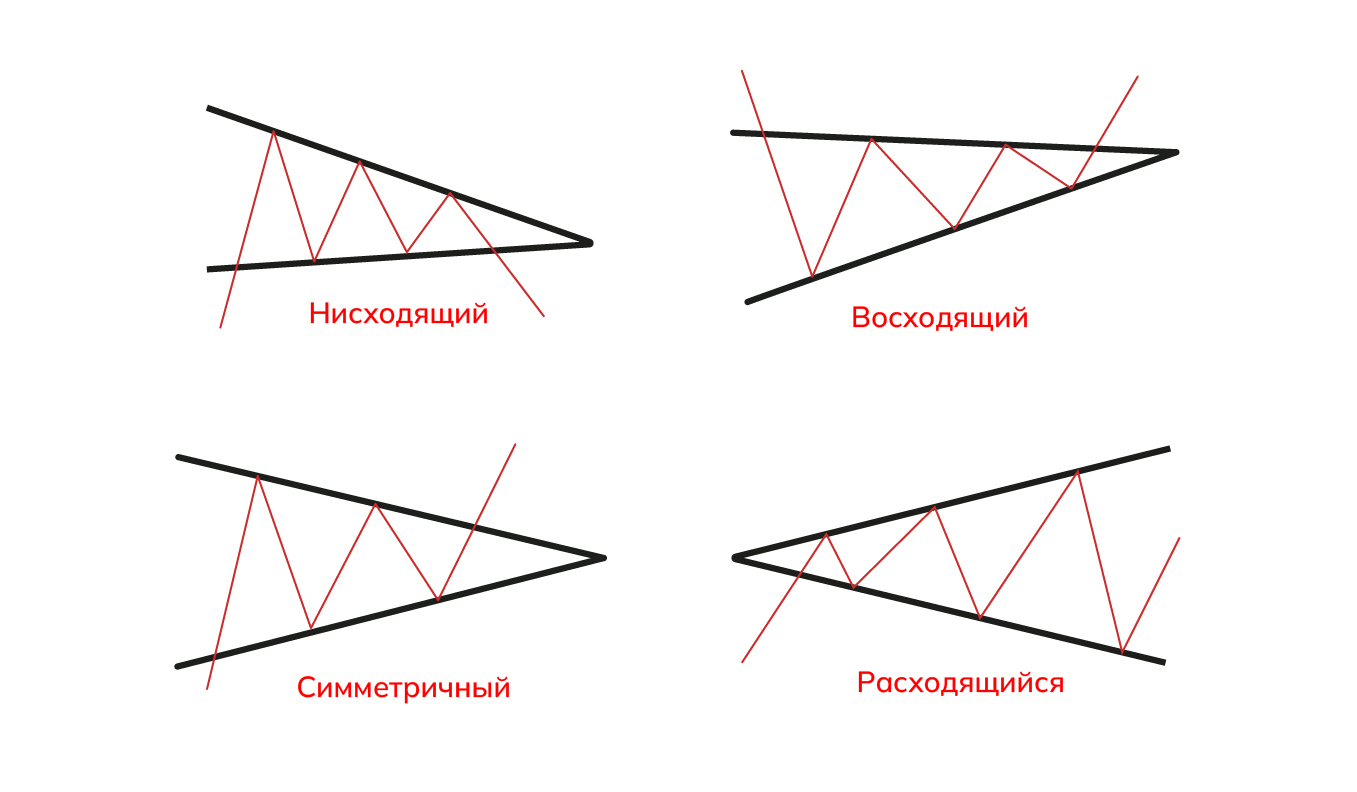
The first pattern we will examine is the "triangle" pattern. A triangle can be one of four types: descending, ascending, symmetrical, or expanding. Interestingly, the triangle pattern can act as both a trend continuation pattern and a trend reversal pattern, depending on the specific case. All types of triangles are schematically shown in the diagram.
If the bisector of the triangle is pointing downward (from the upper left to the lower right corner), it is referred to as a "descending triangle" pattern. If such a pattern is observed after a well-defined preceding bullish (ascending) trend, it is most likely that the bullish trend will continue after the pattern is broken. In this context, the descending triangle pattern is considered a trend continuation pattern. However, if there is no clearly defined bullish trend preceding the pattern, it is more likely that the pattern will be broken downwards, leading to the formation of a new bearish (descending) trend. In this context, the descending triangle pattern indicates a trend formation or reversal. It is not recommended to trade within triangles, as the pattern can be broken in either direction, depending on the specific case. Nevertheless, when the pattern formation is completed, it is advisable to open positions as the "spring effect" tends to occur. Prices that have been tightly compressed within a narrow range tend to break out with significant speed and force, covering a considerable distance.
Typically, the formation of any trend continuation pattern is accompanied by a decrease in selling volume. Volumes fluctuate insignificantly within the pattern and usually increase in the direction where the breakout is most likely to occur. Therefore, if price increases inside the triangle are accompanied by rising volumes, it is most likely that the pattern will be broken upwards, leading to a bullish trend. Conversely, if price decreases within the triangle are accompanied by increasing volumes, it is most likely that the pattern will be broken downwards, indicating a bearish trend.
The possible breakout of the pattern in either direction can also be influenced by the type of long-term trend (ascending or descending), the proximity of significant support and resistance levels, trendlines, etc.
If a triangle pattern is preceded by a trend, and the breakout of the triangle occurs in the direction of the trend, the price is likely to change rapidly after the breakout. The magnitude of the breakout is expected to be equal to the magnitude of the move that formed the pattern. The space within the continuation pattern is typically divided into intervals. If the breakout occurs within the 1/2 to 2/3 length of the pattern, the effect of such a breakout will be maximum. However, if the price entered the last 1/3 of the pattern, consolidation usually occurs, and there is less likelihood of a swift price change. Inside a continuation pattern, there are usually an odd number of swings, rarely fewer than five. The strongest impact occurs when the final wave does not reach the boundary before the breakout.
The "ascending triangle" pattern is identical to the "descending triangle" pattern, except that all statements regarding it are directly opposite. The "symmetrical triangle" pattern does not have a pronounced direction (the triangle's bisector is horizontally oriented). The price behavior after the breakout of this pattern is usually determined by the preceding trend. The "expanding triangle" pattern is less significant as it does not provide clear signals for opening or closing positions in the Forex market.
The next pattern we will discuss is the "flag" pattern. This pattern is represented by an inclined rectangle formed by two parallel support and resistance lines. It is preceded by either a strong price increase (bullish trend) or a strong price decrease (bearish trend). In both cases, the price change before entering the rectangle resembles the handle of a flag. The flag pattern is a continuation pattern and is typically inclined in the direction opposite to the preceding trend. The following two charts depict this pattern in the USD/CHF and USD/CAD currency pairs.

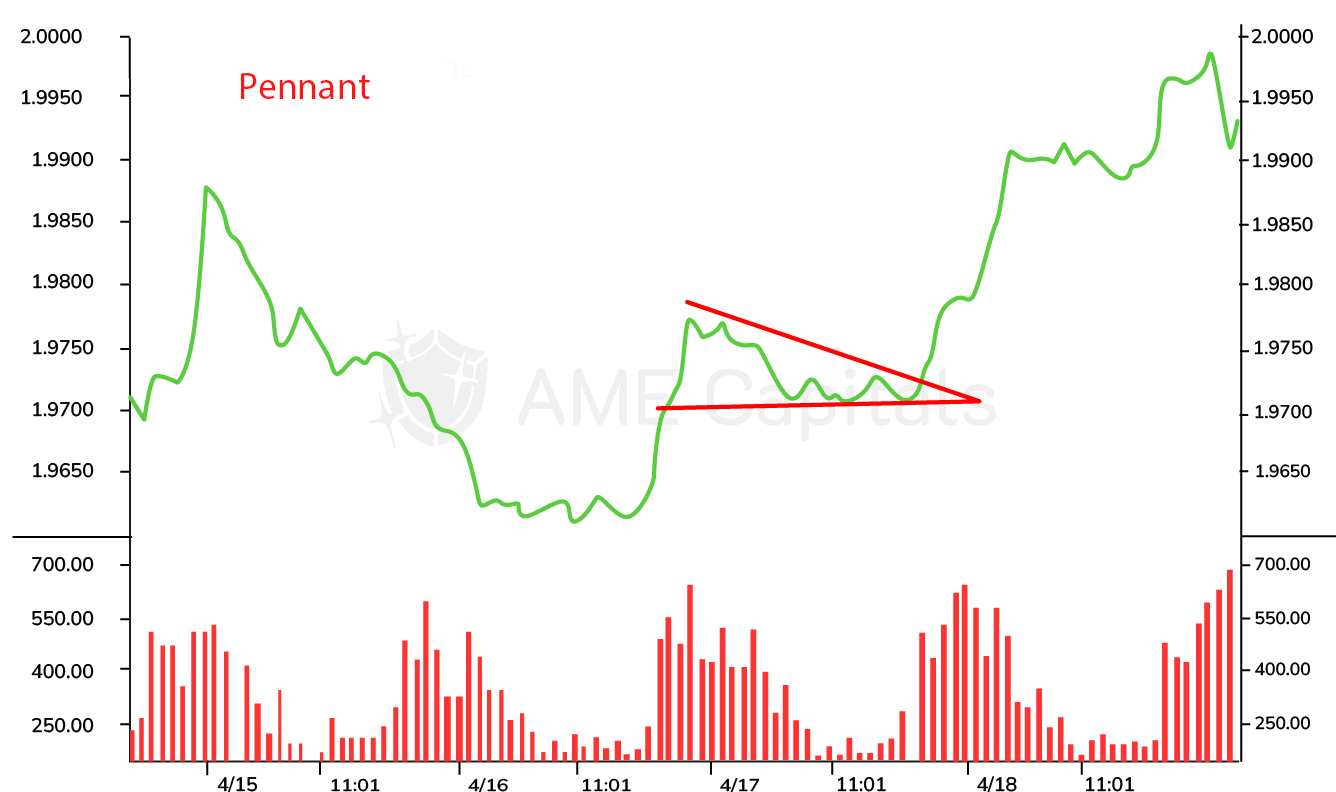
The "pennant" pattern essentially represents a converging triangle and is identical to the "flag" pattern. This pattern is a continuation pattern, and all the characteristics that apply to the "triangle" pattern also apply to the "pennant" pattern. The chart illustrates this pattern in the GBP/USD and USD/JPY currency pairs.
Unlike trend reversal patterns, which are typically analyzed on weekly and monthly charts, continuation patterns can also be identified on intra-day charts. The more pronounced a particular pattern is on a chart, the more traders will be able to recognize it, increasing the likelihood that price will behave as described in theory. When analyzing charts, it is advisable to use standard time frames (such as 5 minutes, 15 minutes, 60 minutes, etc.), as the same patterns may appear differently at different scales. Remember that to be a successful trader, you need to employ the same approaches in technical analysis that are used by the majority of professional market participants.