- AME CAPITALS
- Trading Technology
- Help AME Trading
Part II. Technical Analysis / Chapter 8. Japanese Candlesticks (II)
Next, we will discuss several patterns consisting of two or more Japanese candlesticks. It is worth noting that these patterns are less applicable in the Forex market, as they assume that the closing price of the previous trading period and the opening price of the next trading period do not coincide. The Bullish Engulfing Pattern and the Bearish Engulfing Pattern are illustrated in the diagram.
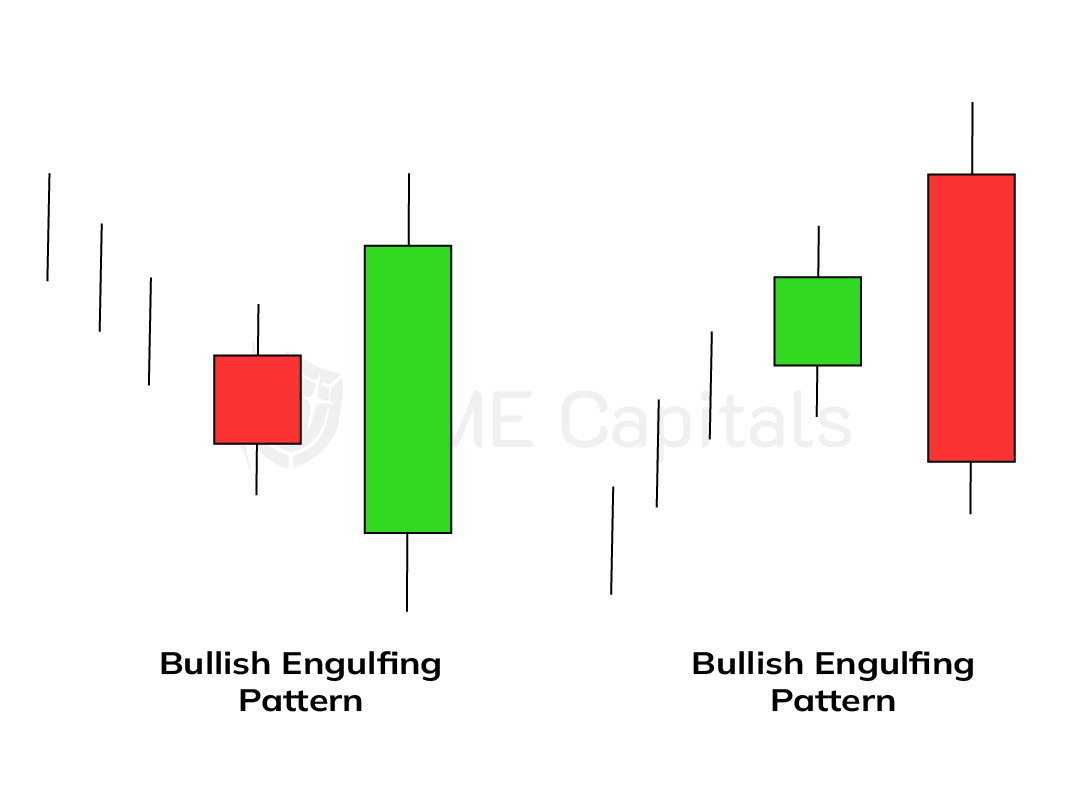
These patterns occur when a long candlestick follows a short candlestick of the opposite color, engulfing it. The patterns are precursors to a trend reversal if they occur in a well-defined downtrend or uptrend, respectively. To determine the type of trend, tools described in the corresponding chapter should be used.
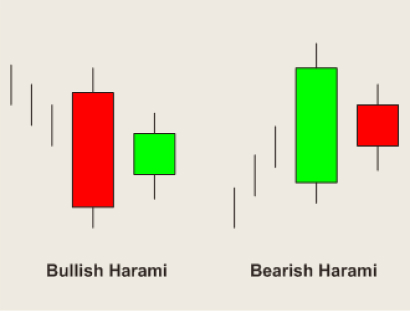
The next pattern we will discuss is called Harami. It can also be bullish or bearish depending on the candlestick type and the preceding trend. These patterns occur when a small-bodied candlestick follows a large-bodied candlestick of the opposite color, indicating a weakening trend. These patterns are illustrated in the diagram.
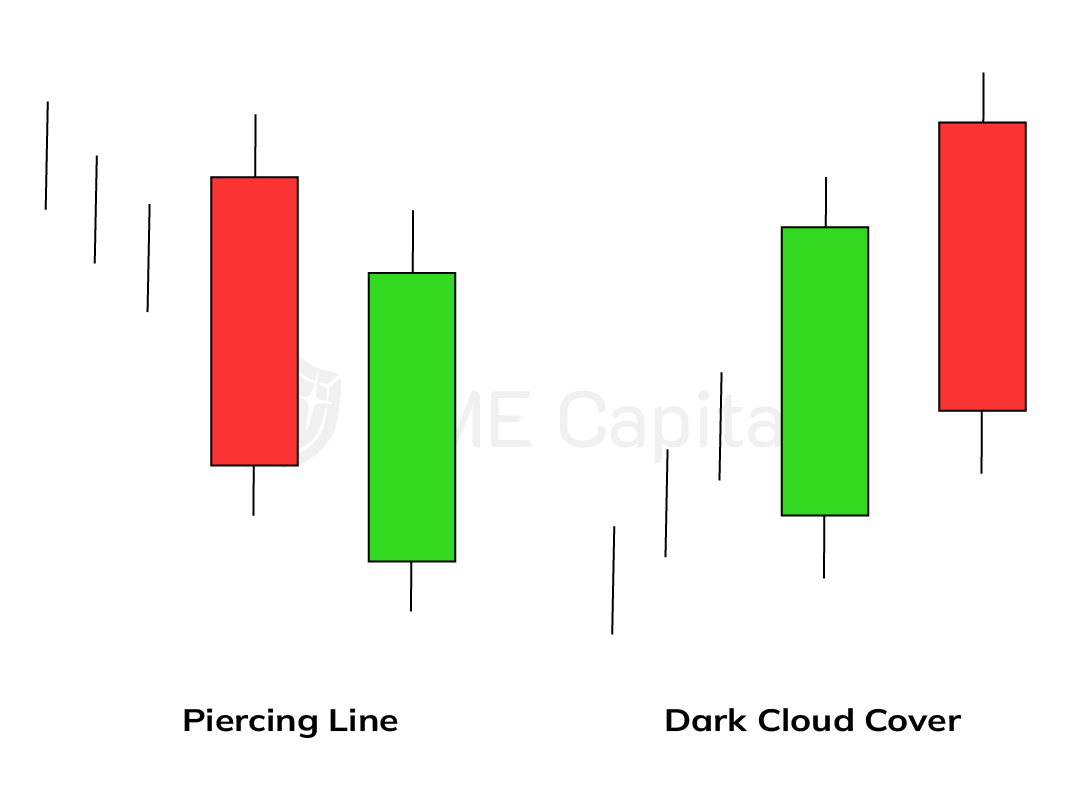
The piercing line pattern and the dark cloud cover pattern are also precursors to a reversal in a downtrend and uptrend, respectively. The piercing line pattern occurs during a downtrend when a long dark candlestick is followed by a long light candlestick. The light candlestick opens below the closing level of the dark candlestick and closes above its midpoint. The dark cloud cover pattern occurs during an uptrend when a long white candlestick is followed by a long dark candlestick. The dark candlestick opens above the closing level of the white candlestick and closes below its midpoint. These patterns are illustrated in the diagram.
The next patterns we will discuss consist of three consecutive candlesticks. They are called the morning star and evening star patterns. In this context, a star refers to a short candlestick that is isolated from the surrounding candlesticks and does not overlap their bodies (although their shadows may overlap). These patterns are illustrated in the diagram.
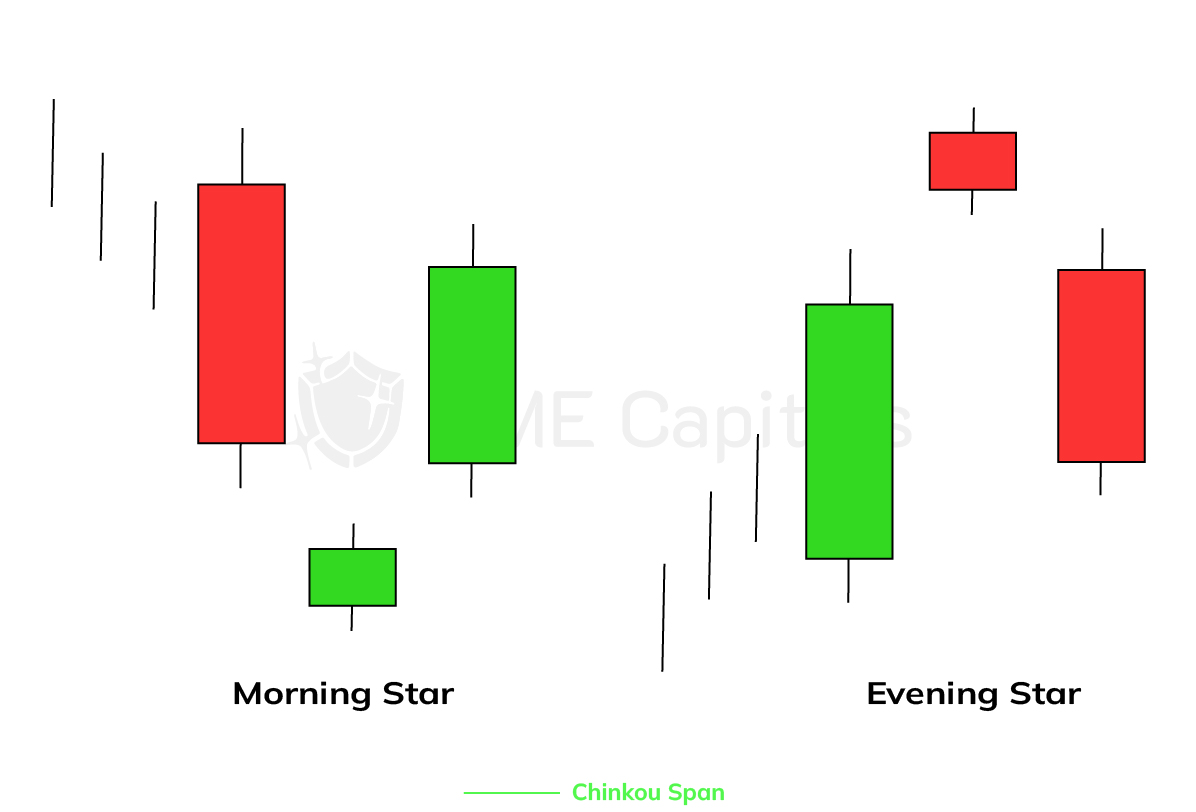
These patterns serve as a signal for a market reversal. The color of the star candlestick (light or dark) is not significant. If we remove the star from the pattern, these patterns would be identical to the piercing line and dark cloud cover patterns.
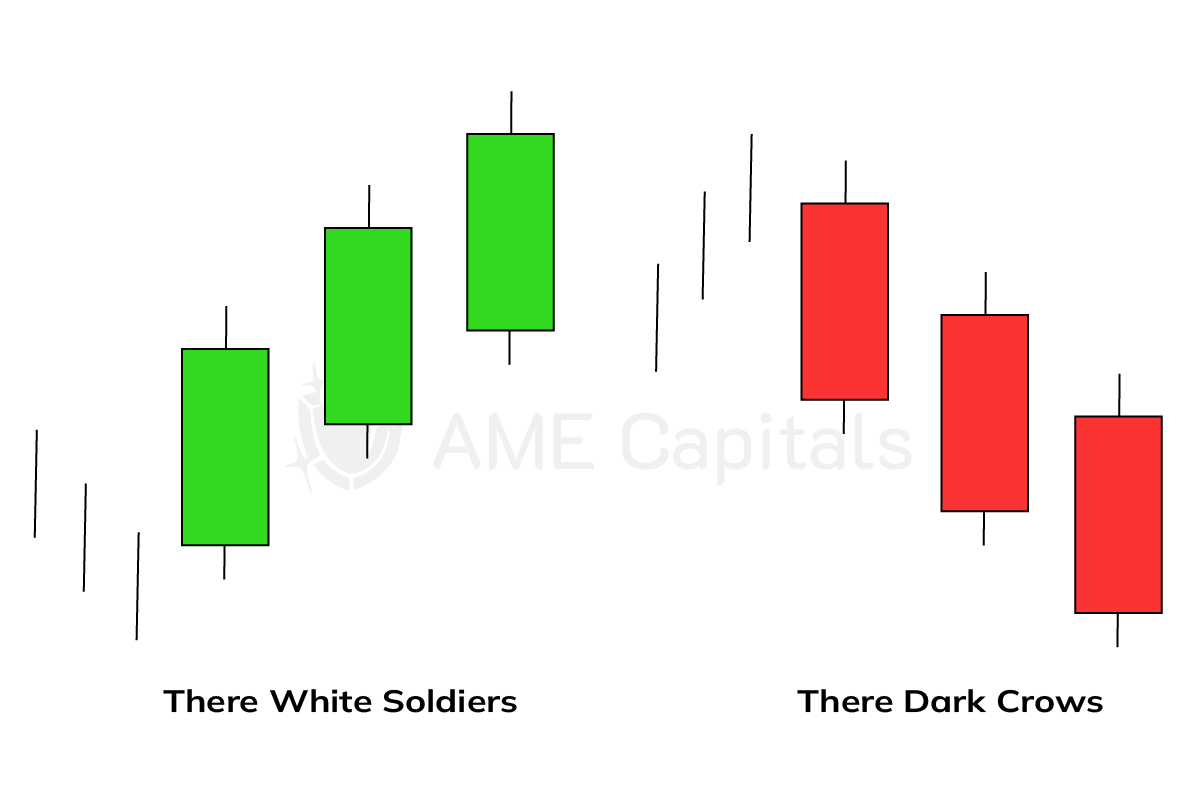
The last patterns we will cover in our Forex education are called the three white soldiers and three black crows. If these patterns occur in a well-defined upward or downward trend, they signal a potential trend reversal. These patterns consist of three candlesticks. Each subsequent candlestick should open within the body of the previous candlestick and close beyond its high (for the three white soldiers) or low (for the three black crows). These patterns are illustrated in the diagram.
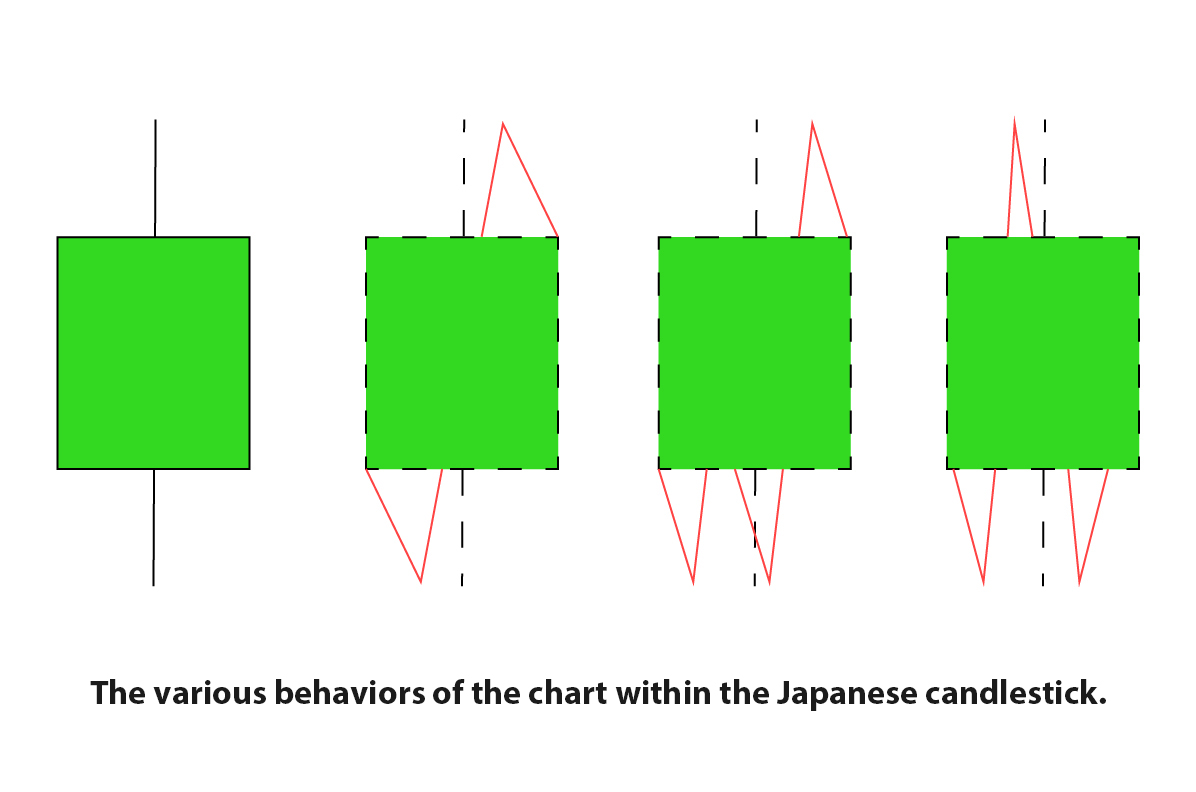
Although different patterns can indicate a trend reversal with a certain probability, it is important to approach them with a degree of skepticism. Firstly, the theory of Japanese candlesticks works best in exchange markets such as the stock market or futures market. Secondly, the analysis of candlestick patterns typically focuses on daily and weekly charts. Thirdly, the behavior within a single candlestick can vary. This concept is depicted in the diagram.