


- AME CAPITALS
- Trading Technology
- Help AME Trading
Part II. Technical Analysis / Chapter 7. Japanese Candlesticks (Part I)
We will continue our Forex education by delving into a more detailed understanding of Japanese candlestick charts. In one of the previous chapters, we discussed types of technical analysis charts, and it was shown that Japanese candlestick charts are widely used by traders in practice. In this chapter, we will familiarize ourselves with different types of Japanese candlesticks and their interpretation of various patterns.
Where did Japanese candlesticks come from? In ancient times, when Godzilla was a little lizard, a Japanese trader named Homma developed a method of analyzing the futures market to forecast prices for rice contracts. Later, this method was studied by a Westerner named Steve Nison and embodied in the theory of Japanese candlesticks, in the form that has survived to this day.
Each candle on a Japanese candlestick chart represents the graphical representation of four components of a trading session: the opening price, the closing price, the low price, and the high price. A Japanese candlestick consists of a real body and shadows. The structure of Japanese candlesticks was extensively discussed in the chapter on types of technical analysis charts, so it will not be repeated in this chapter. We will only provide a diagram from the corresponding chapter that illustrates the construction principle of Japanese candlesticks.
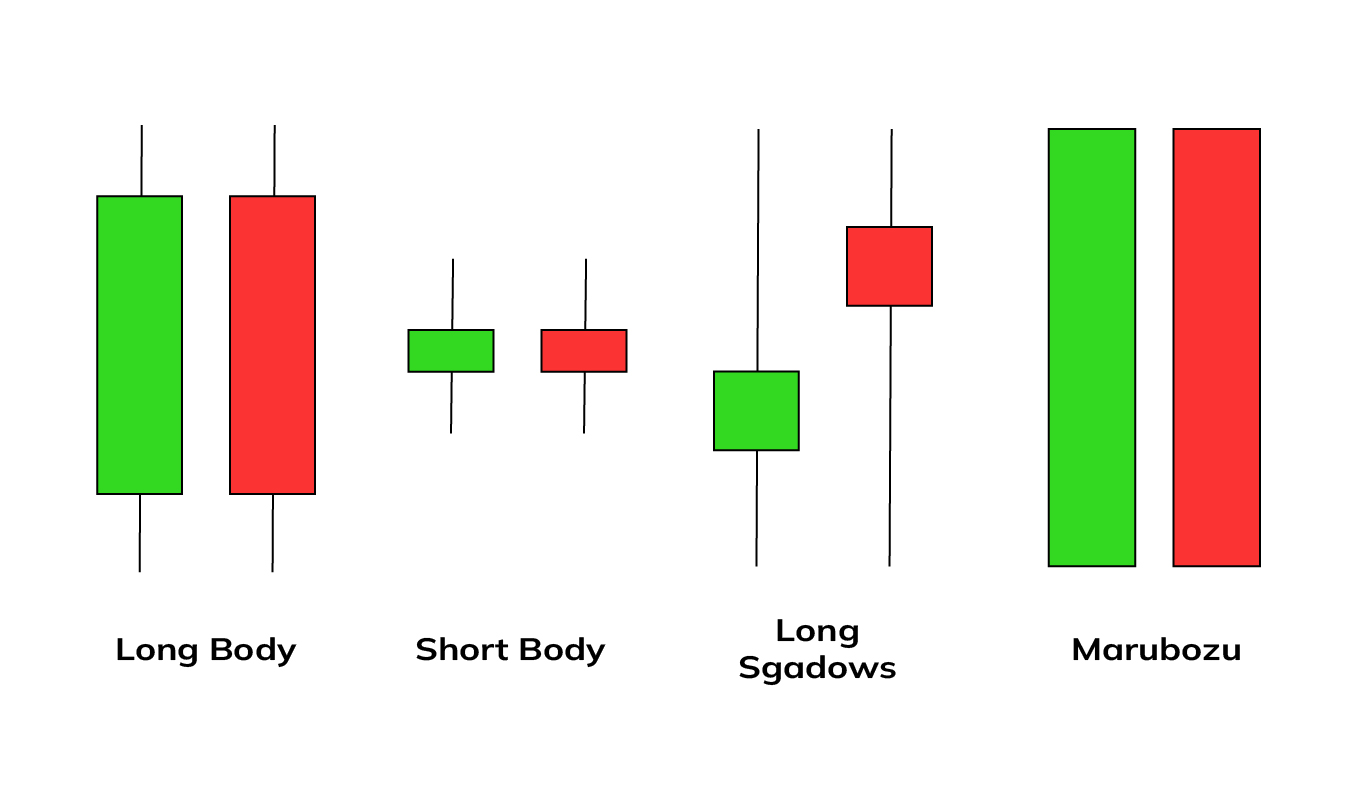
Japanese candlesticks differ from each other in the size of the bodies and shadows. If a Japanese candlestick has a long body and relatively short shadows, it is classified as a "long body" candle. If a Japanese candlestick has a short body and short shadows, it is classified as a "short body" candle. If a candlestick has long shadows, it is classified as "long shadows." When studying patterns of Japanese candlesticks, it is necessary to get used to their peculiar names, as most of them are borrowed from the Japanese language. For example, candles without shadows are called "marubozu." Depending on their type, these candles serve as a good confirmation signal for an upward or downward trend. All the mentioned candles are shown in the diagram below. It is worth noting that all of them can be either bullish candles (light, green) or bearish candles (dark, red).
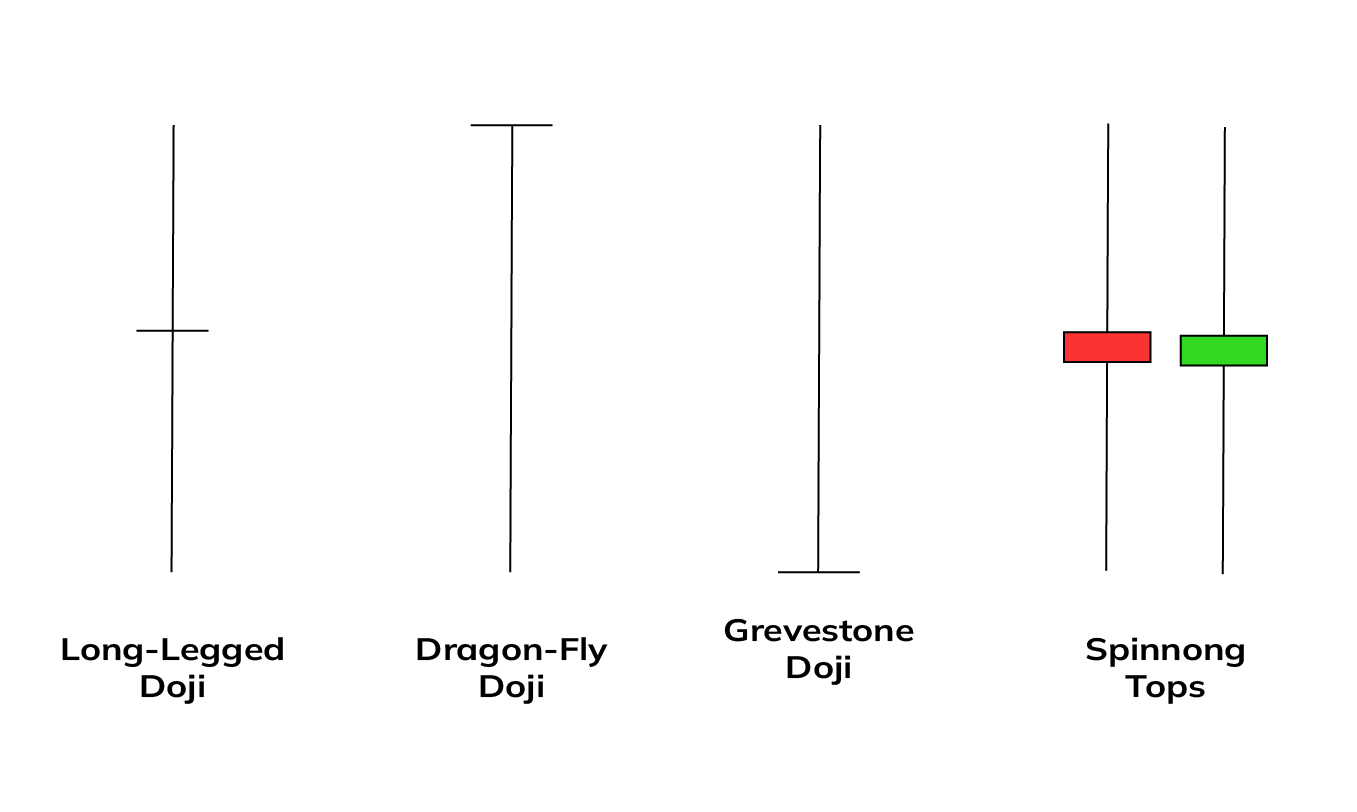
Japanese candlesticks that have virtually no body (opening price equals closing price) are called "doji." Depending on the position of this invisible body relative to the shadows of the candlestick, various subtypes can be identified. For example, the "long-legged doji" candlestick has upper and lower shadows that are nearly equal in length. This candlestick symbolizes that the forces of bulls and bears are balanced, and a trend may form soon. The "dragonfly doji" candlestick has a maximum price that corresponds to the opening and closing prices. This candlestick symbolizes the potential formation of a downward trend. On the other hand, the "gravestone doji" candlestick has a minimum price that aligns with the opening and closing prices, indicating the potential formation of an upward trend. There is a candlestick similar to the long-legged doji but with a short body. This candlestick is called a "spinning top" and also represents market indecision. The longer its shadows, the more likely a new trend will form. All these mentioned candlesticks are illustrated in the diagram for clarity.
The next candlesticks we will discuss can be referred to by different names depending on the type of trend they appear in. These candlesticks are called "hammer," "hanging man," "inverted hammer," and "shooting star." They are illustrated in the diagram.
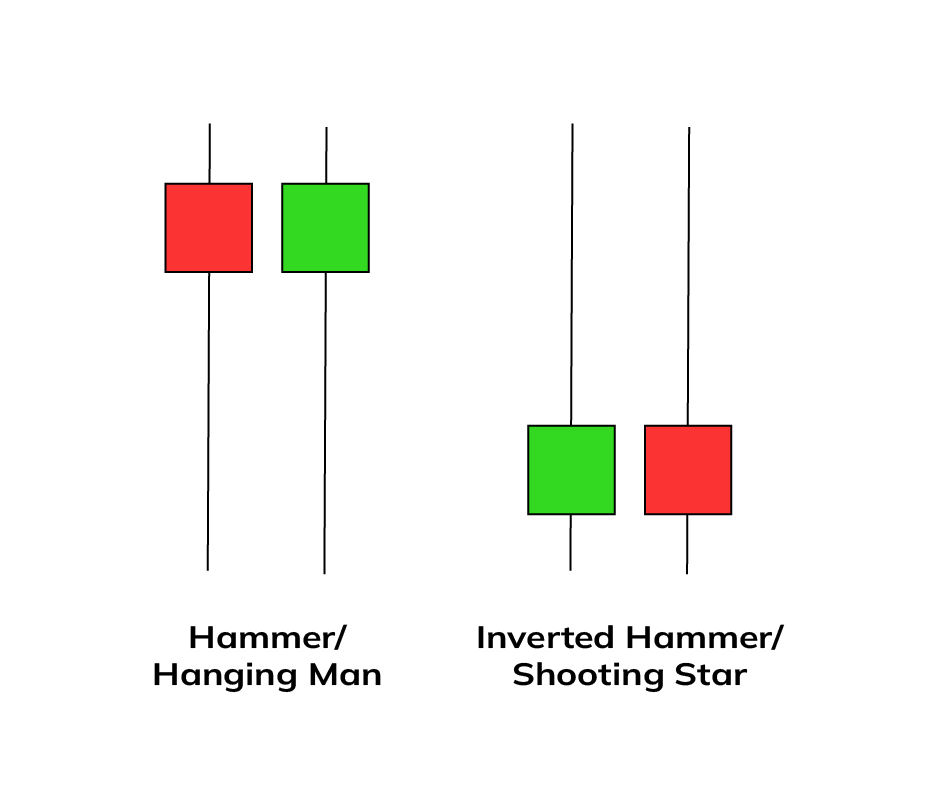
If a candlestick has a very short upper shadow, a long lower shadow, and a medium-sized body, it is called a hammer or a hanging man depending on the preceding trend (a downtrend or an uptrend, respectively). The color of the candlestick (light or dark) is not significant. These candlesticks indicate a potential trend reversal. However, for a final decision on opening or closing a position, confirmation from additional technical analysis indicators, which we will discuss in the following chapters, is necessary. If a candlestick has a long upper shadow and a very short lower shadow, it is called an inverted hammer or a shooting star, again depending on the preceding trend (a downtrend or an uptrend, respectively). The color of the candlestick is also not significant.