


- AME CAPITALS
- Trading Technology
- Help AME Trading
Part II. Technical Analysis / Chapter 19. Fractals and Bill Williams' Alligator
Financial markets have an interesting characteristic – they spend a significant amount of time in a state of calm, and only a quarter of the time can notable trending price movements be observed. To maximize profits from trading in the Forex market, it is necessary to be able to identify the moments when trends begin, as trading within a sideways range can have negative consequences for the trading account.
Fractals, developed by Bill Williams, are an indicator that allows determining market tops and bottoms. The term "fractal" has long been known in geometry as a figure possessing self-similarity properties (each part of the figure resembles the whole figure). Fractals have found their applications in computer modeling of objects such as clouds, trees, coastlines, and others. But let's return to the Forex market and the discussed technical indicator.
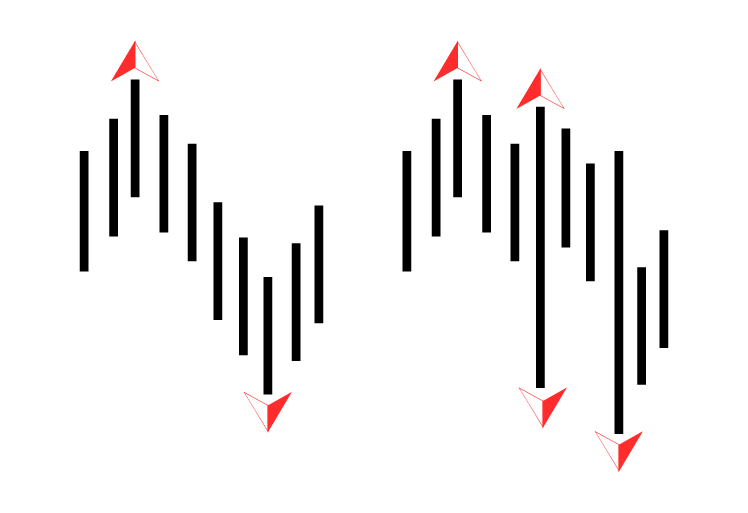
Technically, Bill Williams' fractal consists of a series of at least five consecutive bars. There are two types of Bill Williams' fractals: an up fractal and a down fractal. An up fractal is formed when there is a candle whose high is higher than the highs of the two subsequent candles and the two preceding candles. Similarly, a down fractal is formed when there is a candle whose low is lower than the lows of the two preceding candles and the two subsequent candles. The value of a fractal is determined by the high value (for up fractals) or the low value (for down fractals) of the corresponding candles. Interestingly, the same candle can simultaneously form both an up fractal and a down fractal. To better understand the concept, please refer to the following illustration.
By definition, fractals lag by two candles in generating trading signals. The higher the timeframe, the more real-time lag there is. Fractals themselves provide limited useful information and produce too many false signals. Therefore, they are considered as the "first dimension of financial markets." In other words, to obtain reliable trading signals, it is necessary to use fractals in conjunction with other confirming indicators. The Alligator indicator, presented in the following illustration, is often used as a confirming indicator in Forex market analysis.
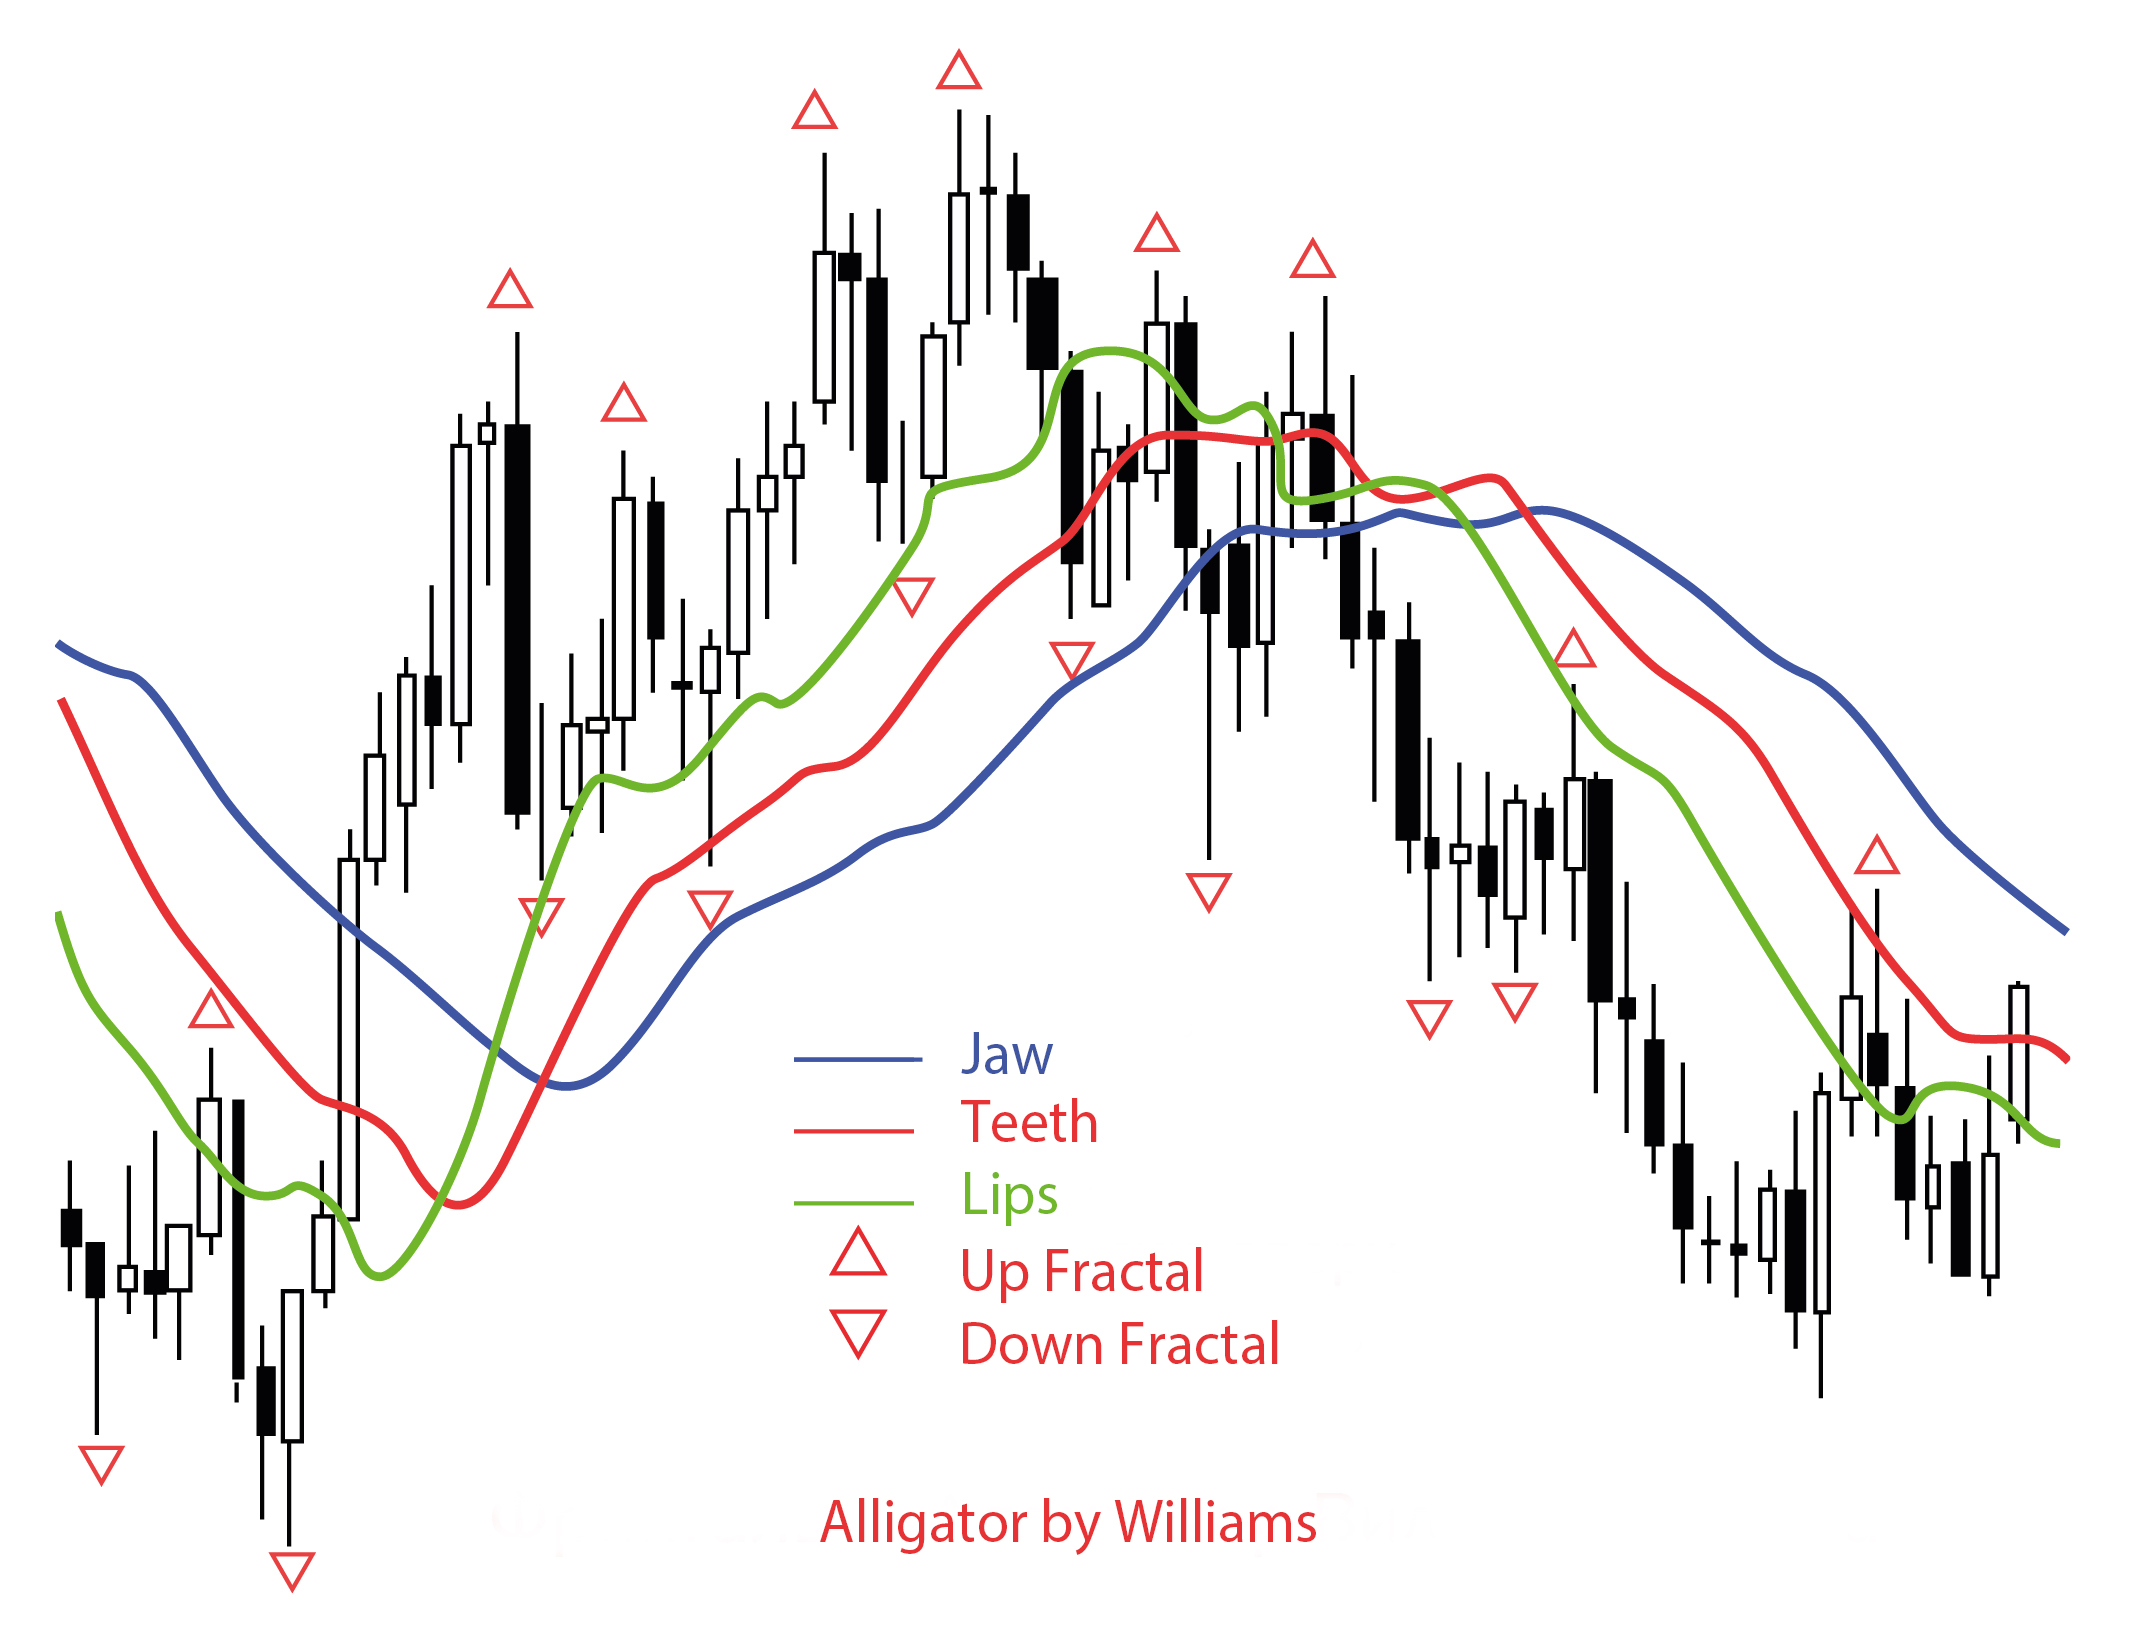
The Alligator indicator is a combination of moving averages of different periods with different shift values relative to the price chart. These moving averages are also referred to as balance lines. This indicator was also developed by Bill Williams and first introduced (along with fractals) in his book "Trading Chaos." When displayed, the indicator consists of three colored lines:
- The blue line (Alligator's jaw) is typically a 13-period smoothed moving average shifted into the future by 8 bars;
- The red line (Alligator's teeth) is usually a smaller order balance line compared to the blue line. It is constructed using an 8-period smoothed moving average shifted into the future by 5 bars;
- The green line (Alligator's lips) completes the construction concept and is based on a 5-period smoothed moving average shifted into the future by 3 bars.
The jaws, teeth, and lips of the Alligator reflect the dynamics of different time periods. We have already mentioned that only a quarter of the time the market is in a trending movement. The Alligator indicator allows traders to follow trends and avoid trading in a sideways range. When the lines of the indicator are intertwined, it is considered that the Alligator's mouth is closed – either it is preparing to sleep or is already asleep. This indicates that the market is in a sideways range. When the Alligator is asleep, its hunger becomes stronger. The longer the Alligator stays in the realm of Morpheus, the hungrier it will be when it wakes up. And the first thing the Alligator does when it wakes up from sleep is to yawn, opening its mouth – in this case, it is considered that the market is coming alive and starting to move. With the mouth open, the Alligator hunts bears and bulls. Once it satisfies its appetite, the mouth will start to close again – this is the time to take profits.
Let's go back to fractals. The signals obtained from fractals should be filtered using the Alligator indicator we just described. Do not consider an up fractal if it is below the Alligator's teeth. Similarly, do not consider a down fractal if it is above the Alligator's teeth.
Fractals provide signals for placing pending Buy Stop and Sell Stop orders (there are four types of pending orders: Buy Stop, Buy Limit, Sell Stop, and Sell Limit). It is important to remember that if an up fractal forms above the Alligator's teeth (the red lines), a Buy Stop order should be placed a few pips above the fractal value (the high of the bar where the fractal formed). On the other hand, if a down fractal forms below the Alligator's teeth (the red lines), a Sell Stop order should be placed a few pips below the fractal value (the low of the bar where the fractal formed).
For reference, a Buy Stop order is a pending order to buy at a price higher than the current market level. A Sell Stop order is a pending order to sell at a price lower than the current market level. Buy Limit and Sell Limit are limit pending orders used to buy at a price lower than the market price and sell at a price higher than the market price, respectively.
Each subsequent fractal formation cancels the previous pending order in the corresponding direction. The decision to open a new pending order is made anew. Fractals depend on the scale of the chart being considered. They will look different on each time frame. If desired, it is possible to create an indicator that displays fractals of all major time intervals (M1, M5, M15, M30, H1, H4, D1, etc.) with different colors on a single chart. However, the standard set of indicators in the MetaTrader 4 trading terminal includes only the standard (classical) version of the fractal indicator.