


- AME CAPITALS
- Trading Technology
- Help AME Trading
Part II. Technical Analysis / Chapter 21. Ichimoku Kinko Hyo Indicator: Construction Principles
In this chapter, we will discuss one of the most exotic technical analysis indicators used in financial markets - the Ichimoku Kinko Hyo indicator. This indicator was developed by a Japanese trader and analyst named Hosoda, who published under the pseudonym Sanjin Ichimoku, from which the indicator derived its name. The Ichimoku Kinko Hyo indicator is included in the toolset of almost all trading programs for financial markets, including the Forex market.
The Ichimoku indicator was initially developed for analyzing the Japanese stock index, Nikkei 225, and gained popularity due to the reliability of its signals. Subsequently, attempts were made to adapt the Ichimoku indicator for analyzing other financial assets, including analyzing currency price movements in the Forex market. Independent analysts have conducted statistical studies confirming the effectiveness of the Ichimoku indicator, but caution should be exercised when using it to make trading decisions.
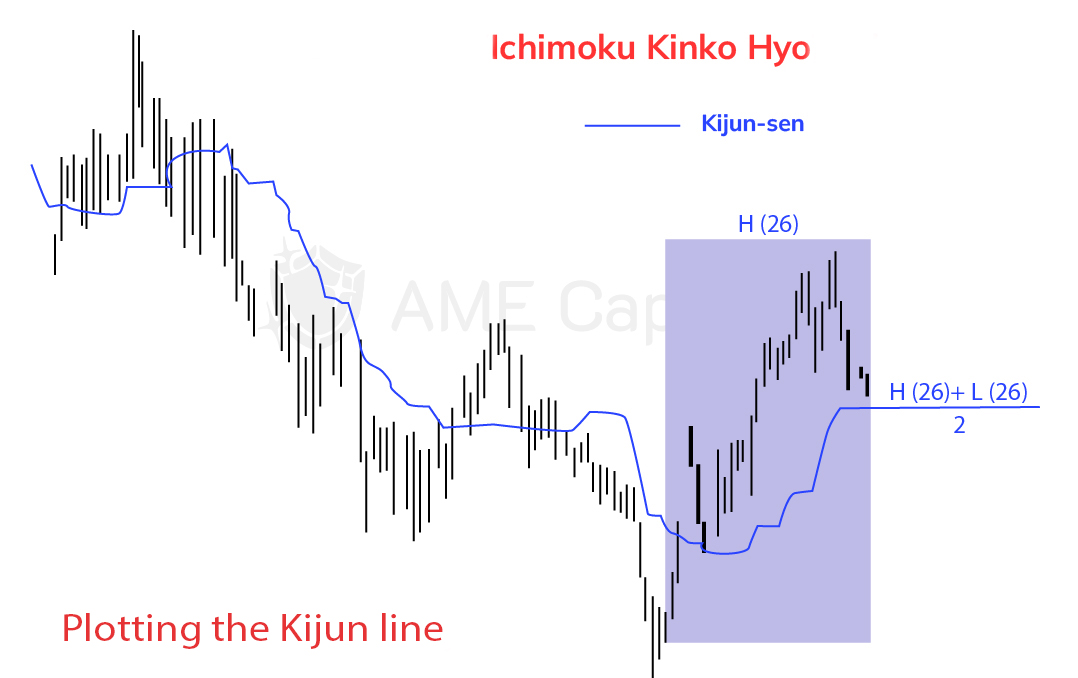
It is important to note that the Ichimoku indicator was originally designed for analyzing weekly charts of the Nikkei 225 index. The default parameters (9, 26, and 52, which will be discussed later) used by the indicator are meaningful only in relation to weekly charts. These parameter values reflect the market activity cycles embedded in the market movement. For example, the value of 52 reflects the number of weeks in a year (the primary market cycle), and 26 reflects the number of weeks in a half-year. Since most Forex traders use daily or hourly charts for their trading, the Ichimoku indicator needs to be adjusted in a way that its parameters have specific economic significance to the cyclic processes occurring in the market. Ishimoku does not provide advice on adjusting his indicator for lower timeframe charts, so this process is entirely up to the traders, and each trader finds their optimal parameter values.
To begin, please refer to the following chart, which shows the Ichimoku indicator applied to the daily chart of the USD/JPY currency pair using the default indicator parameters (9, 26, and 52), although ideally, weekly charts should be used.
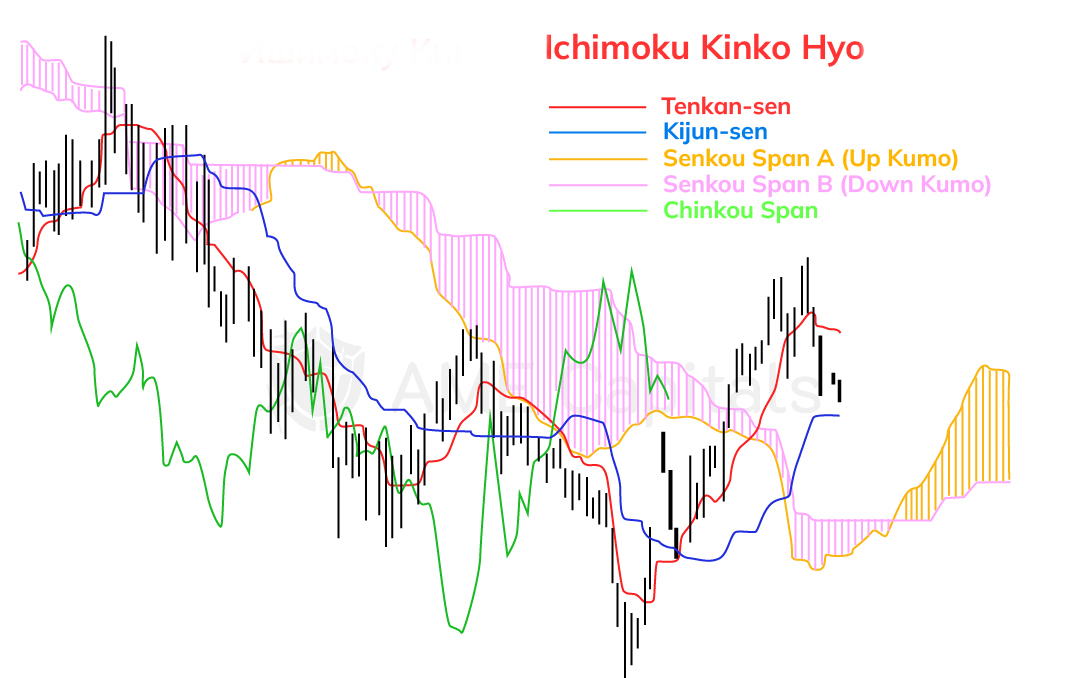
At first glance, the Ichimoku indicator may appear cluttered with lines, making it difficult for uninitiated traders to understand its meaning. The indicator consists of five lines, each with its own name and interpretation. We will examine each line individually along with the algorithm for constructing them. Tenkan is a short-term trend line that represents the average value of the price range determined by the first parameter of the Ichimoku indicator (typically set to 9 by default, as recommended by Hosoda). The principle of constructing the Tenkan line is illustrated in the chart below.
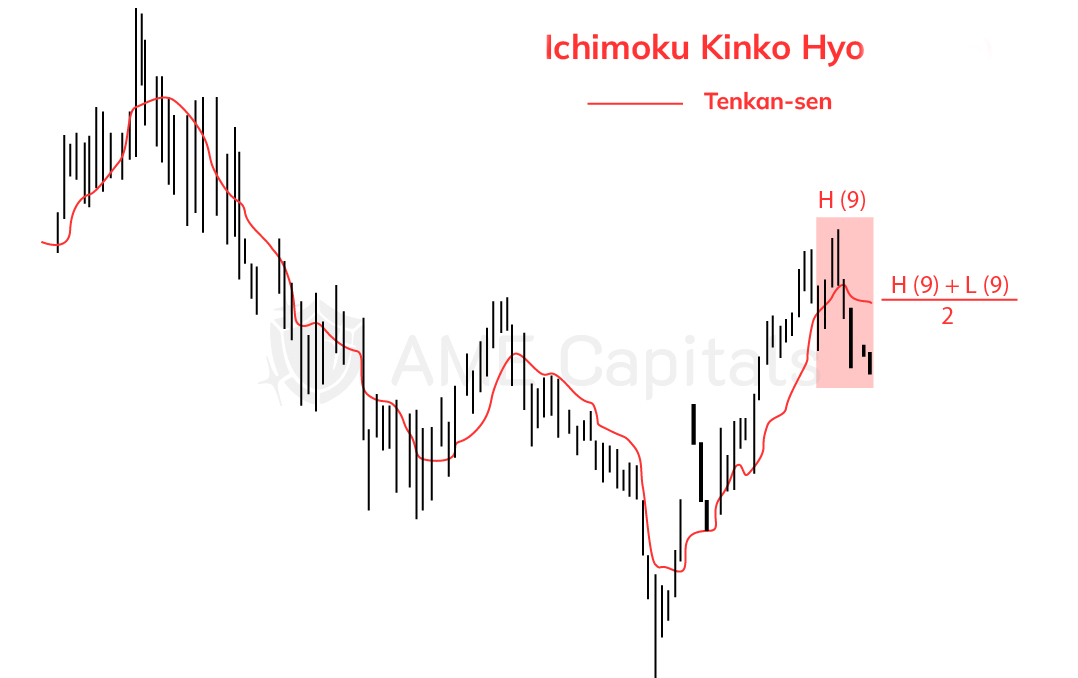
For each newly formed bar, the price range formed by the last 9 bars, including the current one, is considered. The midpoint of this range, defined by the bar with the lowest low and the bar with the highest high, represents the Tenkan line corresponding to the new bar. This line serves as an indicator of the trend direction, where a steeper slope indicates a stronger trend. It's important to note that the Tenkan line with a period of 9 and a simple moving average with a period of 9 are not the same. The Tenkan line considers the highest and lowest prices of the range, rather than the average price (open, close, or any other price of the bar). This approach minimizes the lag of the indicator line since even a single bar can significantly influence the range formed by the previous bars.
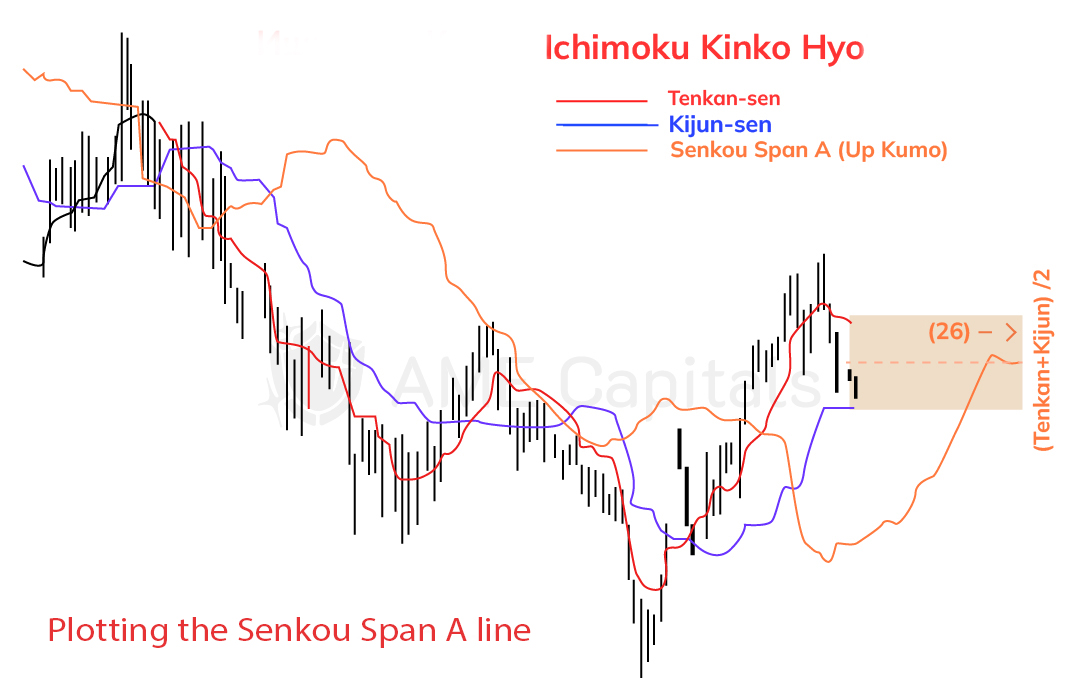
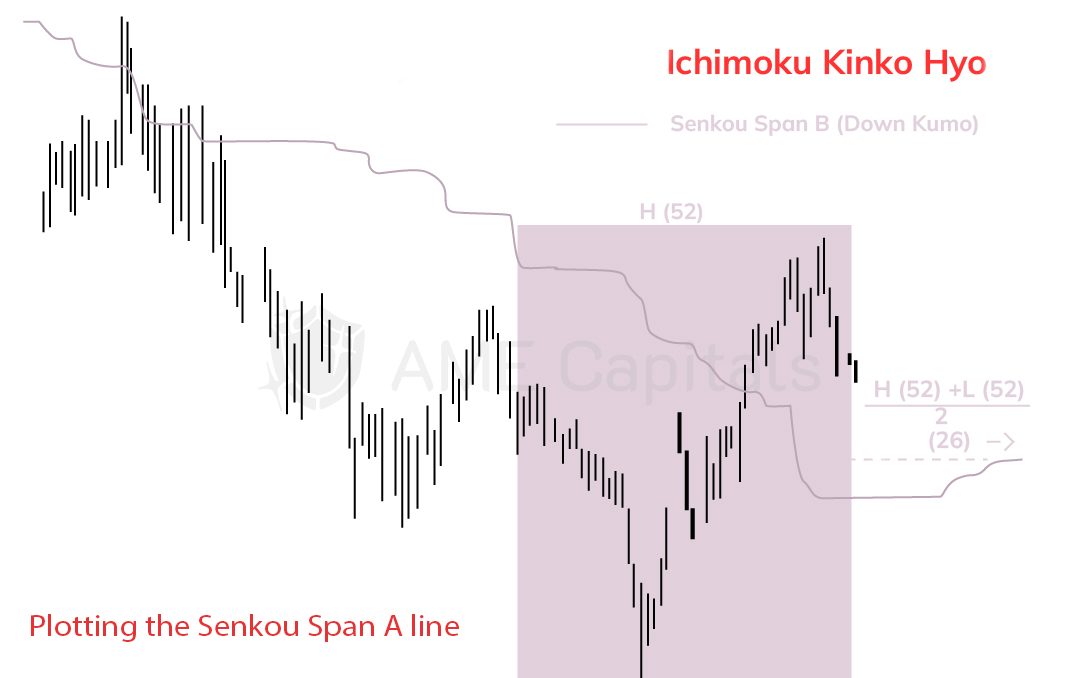
The fourth line of the indicator is called Senkou Span B. It represents the midpoint of the price range determined by the third parameter of the Ichimoku indicator (typically set to 52 according to Hosoda's teachings), shifted to the right by the number of bars specified by the second parameter (value of 26). The principle of constructing the Senkou Span B line is illustrated in the following chart.

It's important to note that both Senkou Span lines lead the price chart by 26 bars (the second parameter of the Ichimoku indicator). Additionally, these lines form a formation known as the cloud. The cloud is filled with the color of the line that is currently above. The Ichimoku cloud is shown in the following chart.

The lines of the Ichimoku indicator described above are a source of trading signals. Based on their construction principles, the first four lines of the indicator can serve as effective support or resistance curves. According to the teachings of the theory's author, traders should either trade breakouts or bounces from these lines, opening positions in the direction of the breakout or bounce. Additionally, the intersection of the lines themselves can provide valuable trading signals. The fifth line of the Ichimoku indicator differs significantly from the others and generates trading signals when it intersects with the price chart (or when there is a breakout from the price chart, although Hosoda himself did not explicitly discuss this in his theory). The signals generated by the Ichimoku indicator will be thoroughly explained in the next chapter of our Forex education on the Forex Arena information portal.