


- AME CAPITALS
- Trading Technology
- Help AME Trading
Part II. Technical Analysis / Chapter 20. Fibonacci Numbers, Ratios, Lines, Fans, Arcs, and Time Zones
Despite the apparent randomness of processes in nature, there are sometimes patterns that can be identified. One example of such patterns is the principle of self-similarity in fractal geometry (where individual parts of an object resemble the whole object) - we discussed this when examining Bill Williams' Fractals. Another interesting pattern is the golden ratio.
The golden ratio is the division of a segment into two unequal parts, where the ratio of the smaller part to the larger part is equal to the ratio of the larger part to the entire length of the segment. If we consider the following diagram, for the golden ratio, a/b = b/c (where c = a + b).
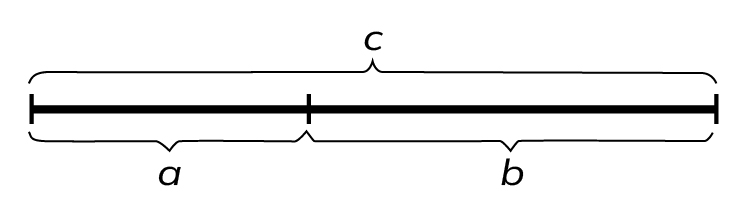
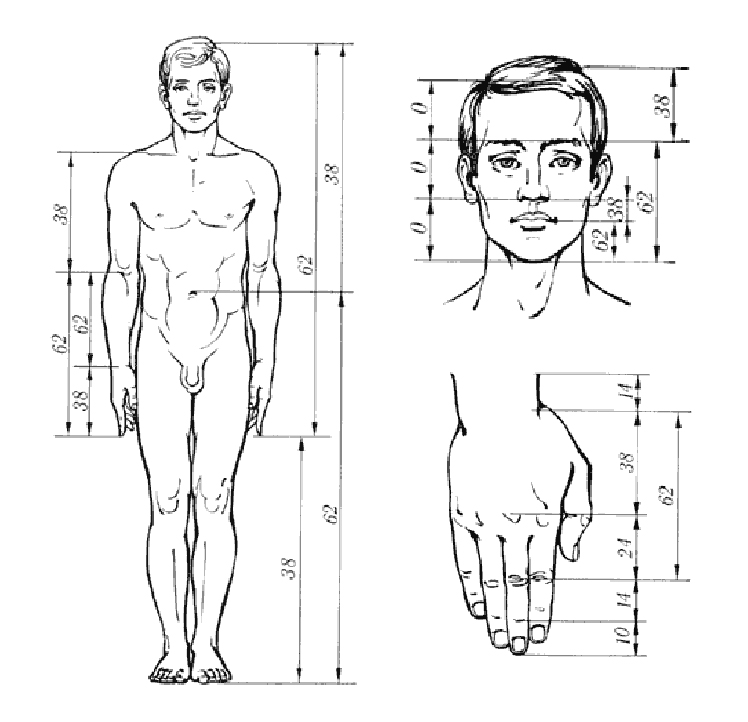
The value of the fraction itself is expressed as an irrational value, approximately equal to 0.618 when rounded. If we consider a unit segment, the golden ratio divides it into segments with lengths of 0.618 and 0.382. The golden ratio was discovered by the ancient Greek philosopher and mathematician Pythagoras in the 6th century BCE. Interestingly, many living forms in nature, including the human body, demonstrate approximate division based on the golden ratio. For example, the distance from the feet to the fingertips of outstretched hands and the distance from those fingertips to the top of the head are in the proportion mentioned above. There are numerous other examples on the face and palm of a person as well – refer to the diagram.
It turns out that these numbers are also coefficients in the "magical" Fibonacci sequence, named after its Italian discoverer Leonardo of Pisa, better known as Fibonacci (son of Bonacci). Fibonacci numbers are a sequence of natural numbers in which each subsequent number is the sum of the two preceding numbers (the first two numbers in the sequence are 1). Thus, when we refer to Fibonacci numbers, we understand the following sequence: 1, 1, 2, 3, 5, 8, 13, 21, 34, 55, 89, 144, 233, and so on.
The Fibonacci coefficients are the limits of various combinations of sequence members. For example, the limit of the ratio of the previous number to the subsequent number is equal to the value of the fraction we just discussed, the golden ratio of 0.618. The limit of the ratio of the previous number to one through the subsequent number is 0.382 (which is also the difference between 1 and 0.618). The limit of the ratio of the subsequent number to the previous number in the Fibonacci sequence approaches 1.618 (pay attention to the fractional part of the number). The limit of the ratio of the subsequent number to one through the previous number approaches 2.618 (again, note the digits after the decimal point). If you square the number 1.618, you get a value close to 2.618. And if you cube it, you get a value close to another Fibonacci coefficient, the limit of the ratio of the subsequent number to the second previous one (4.236). Truly, the magic of numbers!
So, we have identified the main Fibonacci coefficients, which include the numbers 0.382, 0.618, 1.618, 2.618, and 4.236. If these numbers so well highlight the proportions of objects and processes in the natural world, why not try to find their connection to processes occurring in financial markets? And indeed, this has been done, and two more key numbers, 0.5 and 1, have been added to the sequence. In such a set, you can encounter Fibonacci coefficients in the corresponding graphical tools of almost all analysis and trading programs in financial markets.
The simplest graphical tool is considered to be Fibonacci retracement lines. The principle of their construction is straightforward: you identify two reference levels on the price chart, with the first corresponding to the 100% mark and the second to the 0% mark. Between these levels, horizontal lines are drawn in the proportions of the Fibonacci coefficients (lines with coefficients greater than 100% are drawn beyond the indicated levels). The lines are typically labeled in percentages: 38.2%, 50%, 61.8%, 100%, 161.8%, 261.8%, and 423.6%. The key aspect of constructing this graphical tool is the selection of reference lines. It is believed that significant price chart extremes, such as key support and resistance levels, should be considered for this purpose. In other words, the reference lines are drawn from the established key maximum (100%) to the previous key minimum (0%) in a bull market, and vice versa in a bear market. Fibonacci lines (in classical theory) indicate future support and resistance levels (the end of a corrective movement in strong trends and the continuation of the main trend). There are many principles of interpreting Fibonacci lines and generating trading signals based on them, but these systems go beyond the scope of our training. An example of applying Fibonacci lines to a price chart is shown in the diagram.
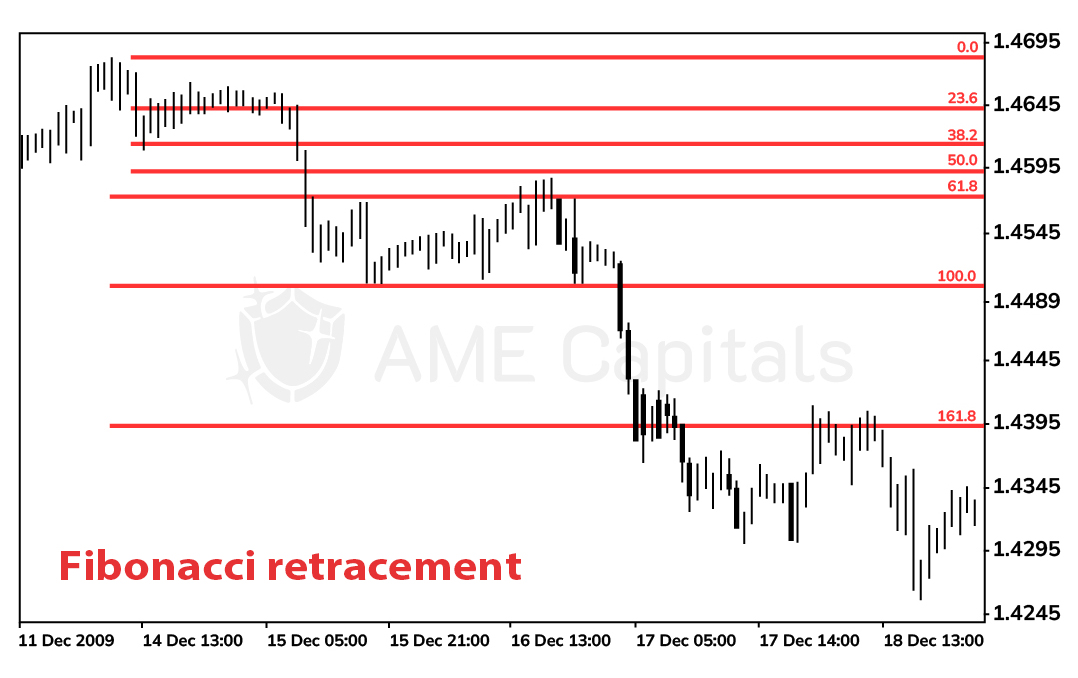
From the diagram, it can be observed that in a downtrend (bear market) and by properly setting the support levels of the indicator, a new resistance level is established at the 61.8% mark. It can also be noted that the 161.8% level became a significant resistance level in the future. Such dependencies can often be seen on historical charts, but using Fibonacci lines for real-time decision-making is quite challenging.
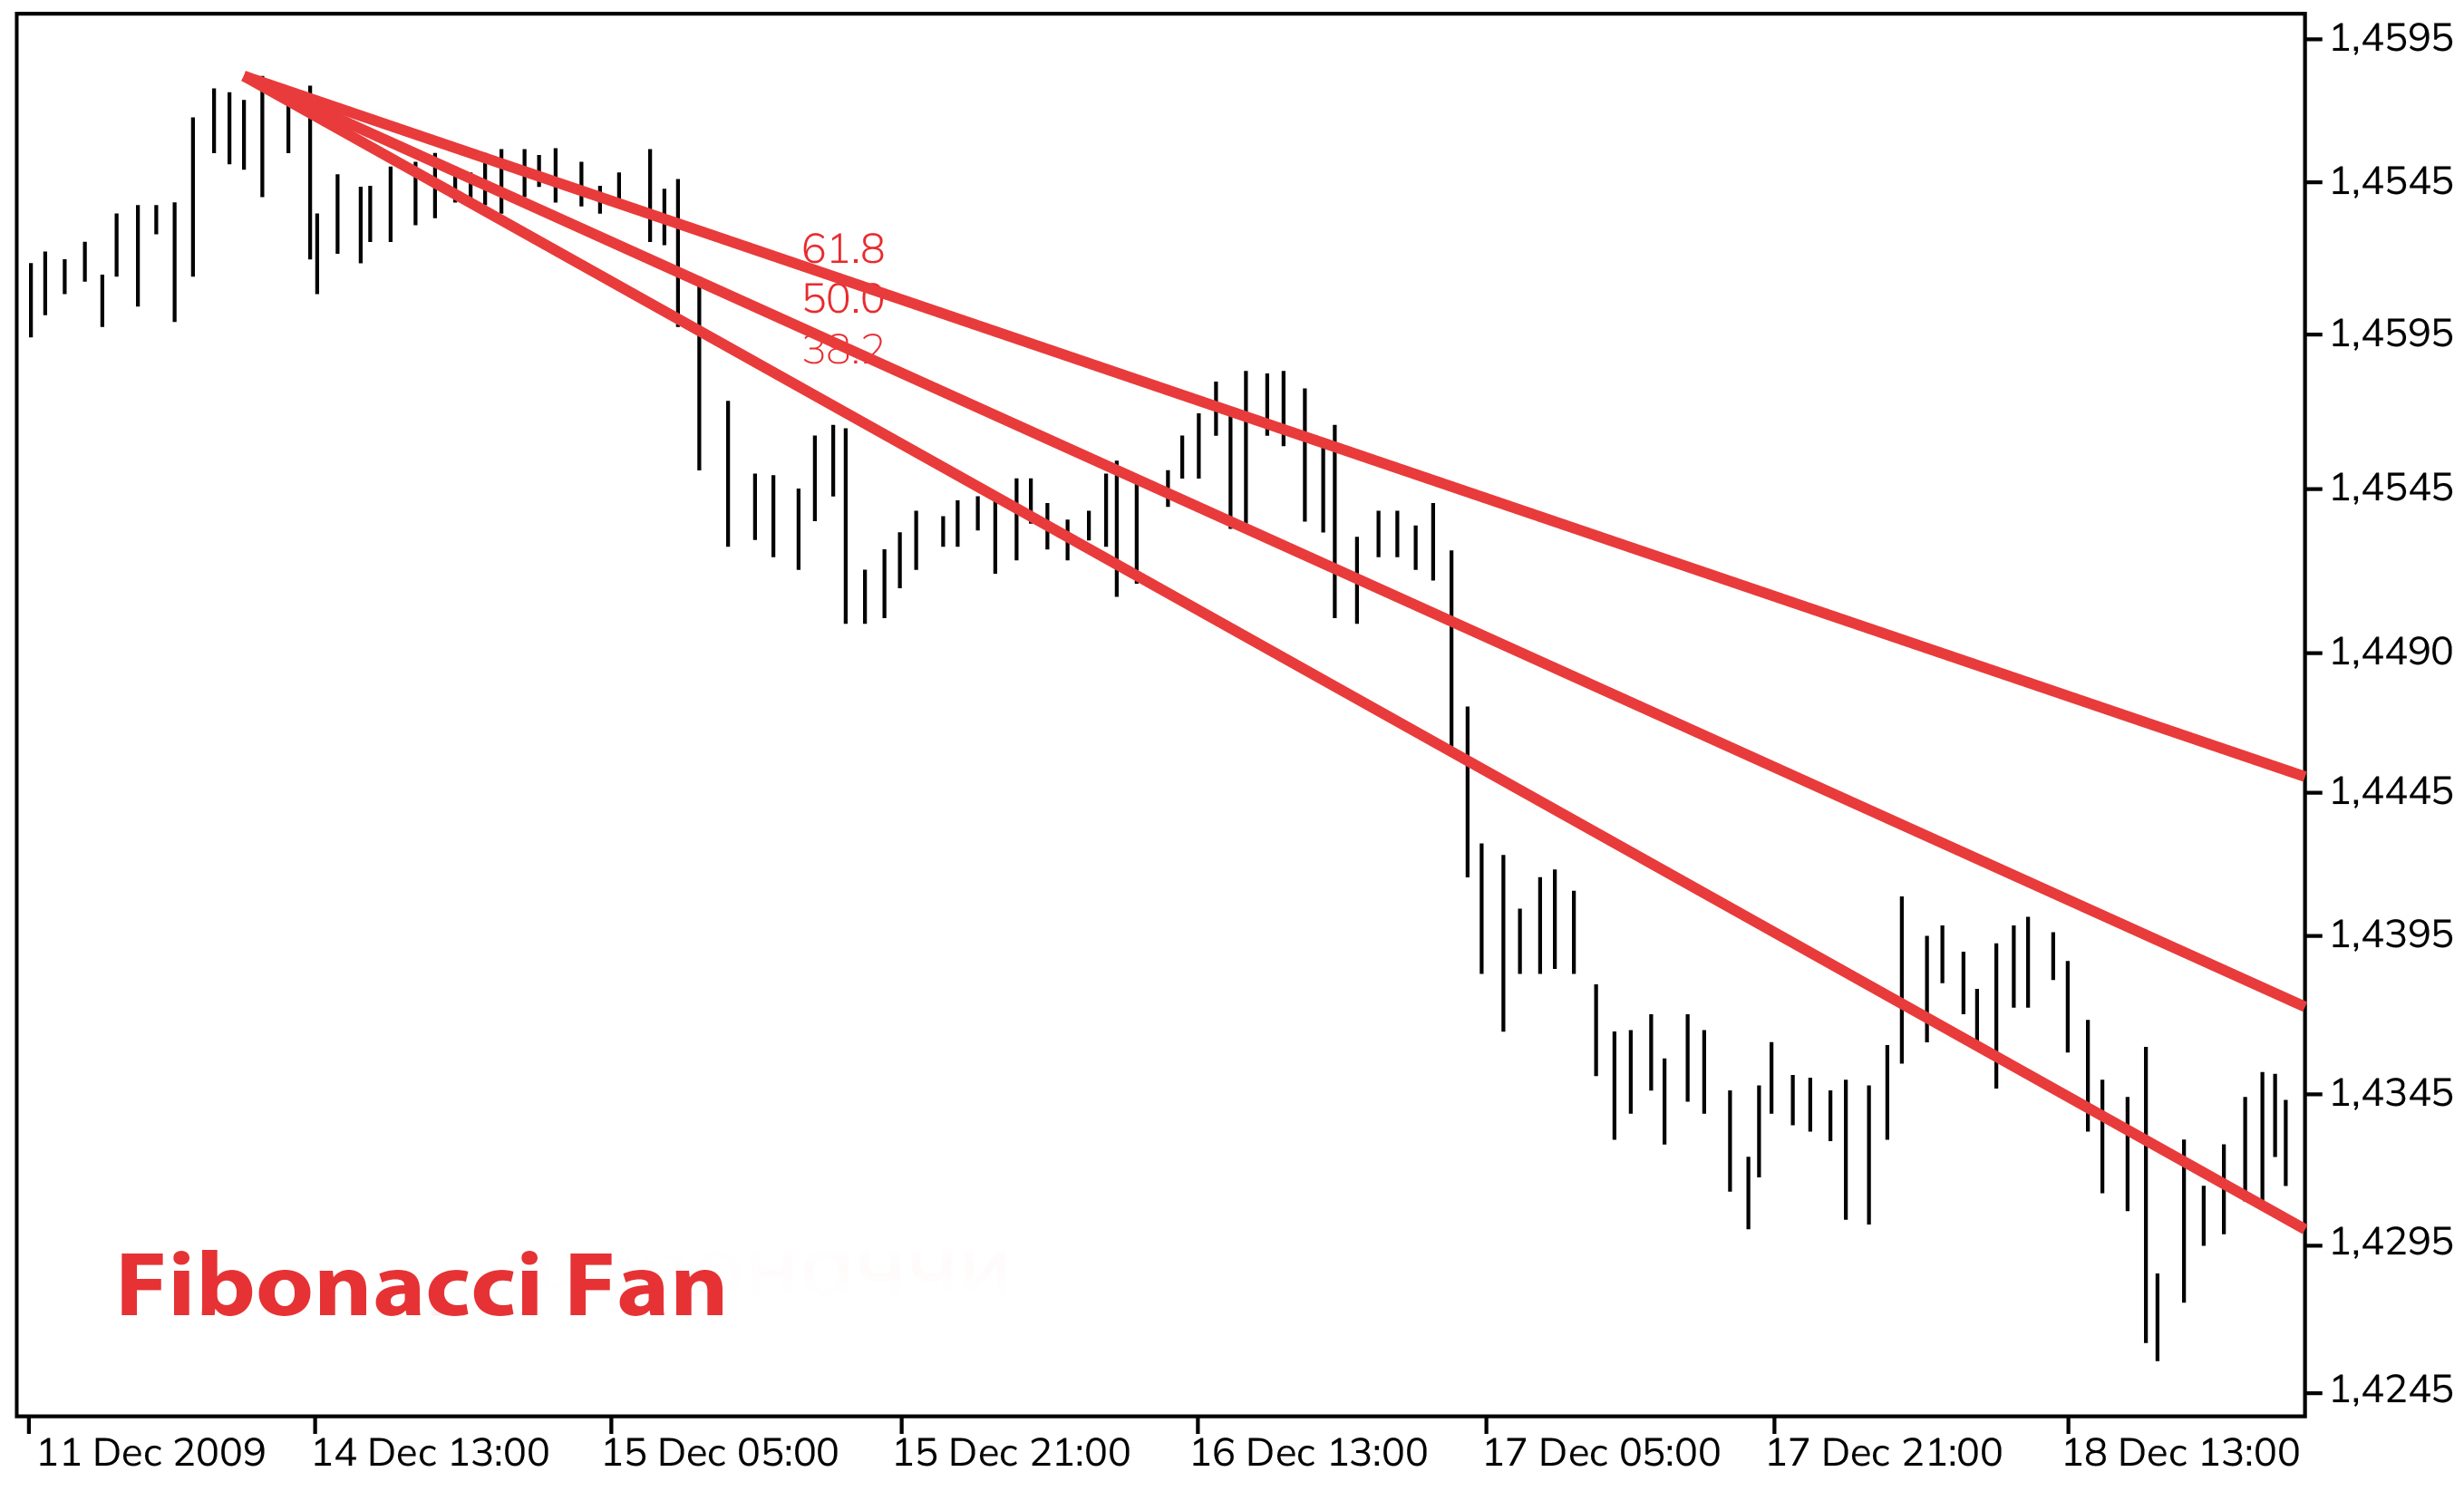
Another graphical tool based on Fibonacci ratios is the Fibonacci fan. To construct a Fibonacci fan, two points on the chart are required, typically significant price extremes. The first point establishes the base of the fan, and the second point allows for the completion of an imaginary rectangular triangle. The height line of this triangle is divided in Fibonacci ratios, forming segments. The Fibonacci fan lines pass through the boundaries of these segments. Despite the apparent complexity of the construction principle, it is relatively straightforward. The fan lines (in theory) can serve as future support or resistance lines. The Fibonacci fan is shown in the following diagram.
In addition to the previously described Fibonacci graphical tools, Fibonacci arcs have gained wide popularity. They are constructed as follows: similar to the Fibonacci fan, two extreme points are selected, through which a straight line (reference line) can be drawn, defining the trend (not to be confused with a trendline). The second point serves as the center of the future ellipse. One of the ellipse's radii is determined by the condition that the ellipse must pass through the first point of the reference line. The second radius of the ellipse is empirical and set by the terminal developers. Typically, it can be adjusted in the settings of the graphical tool. In the MetaTrader 4 trading terminal, setting the "scale" parameter to 10.0 in the Fibonacci arcs settings results in the display of a perfect circle. By default, the parameter is set to 1.0, which significantly elongates the ellipse along the horizontal axis. Fibonacci arcs are shown in the following diagram.
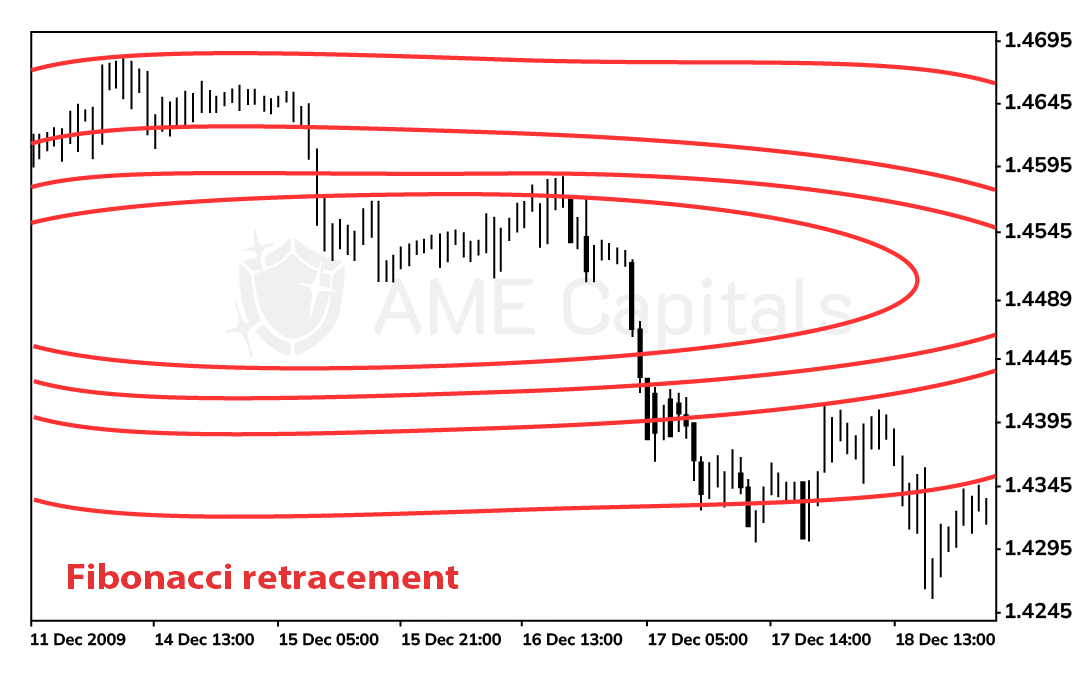
The secret lies in the fact that not just one ellipse is constructed according to the described principle, but several. To construct a series of additional ellipses, the reference line (connecting the two extremes) is divided into segments by Fibonacci ratios, starting from the center of the ellipse (the second point). Additional ellipses are then drawn through the boundaries of these segments. Typically, the Fibonacci arcs graphical tool only draws half of the ellipse on the chart (the upper half on the bearish reference line and the lower half on the bullish reference line), which is why it is named "arcs". The arcs themselves (in theory) serve as indicators of potential future support and resistance levels. Fibonacci arcs are usually used in conjunction with Fibonacci fans. By using both tools, future support and resistance levels are determined by the points where the arcs and fans intersect.
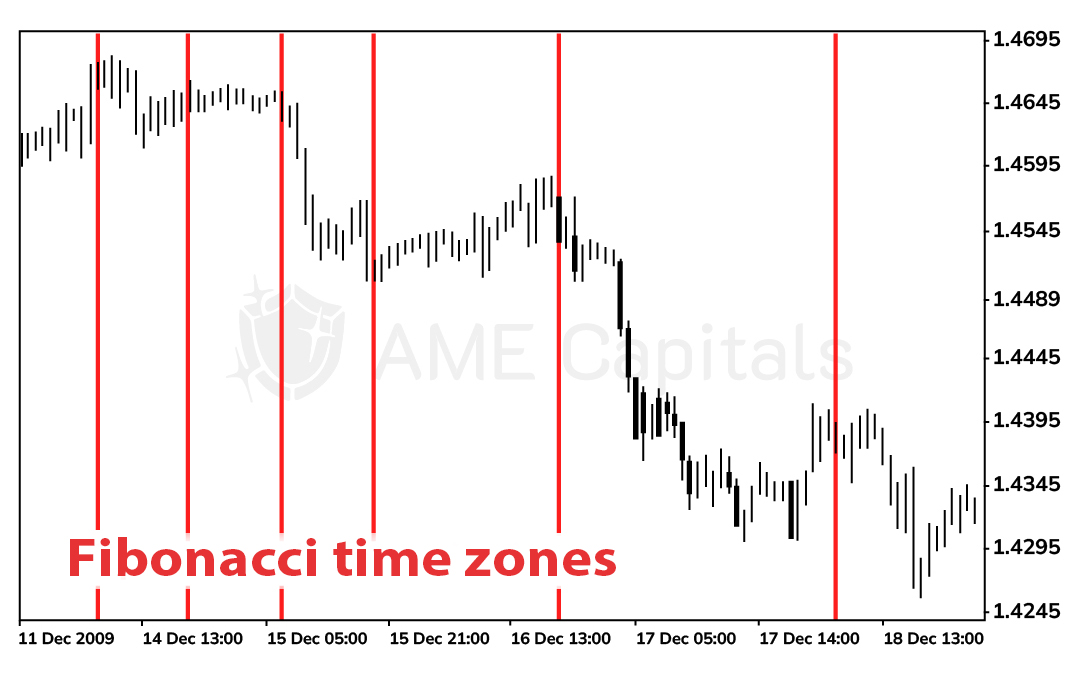
The last graphical tool in the Fibonacci series that we will discuss is Fibonacci time zones. Fibonacci coefficients are not used to construct them; instead, the actual numbers from the Fibonacci sequence are utilized. To construct Fibonacci time zones, the trader selects a significant time interval on the chart (corresponding, for example, to a significant price fluctuation), which is considered as the unit. Time intervals of 1, 1, 2, 3, 5, 8, 13, and so on, are then plotted to the right of this interval. It is believed that these time intervals may correspond to future significant price fluctuations. Fibonacci time zones are shown in the diagram below.
Indeed, we have explored the numbers, coefficients, lines, fans, arcs, and time zones of Fibonacci. We have emphasized the fact that Fibonacci coefficients can be observed in many natural processes. There is a theory that financial markets can be analyzed using Fibonacci graphical tools. However, there is no scientific explanation for this theory, only conjectures and practical experience from applying these graphical tools to historical data and real trading. Each trader has their own practical experience. If you want to determine whether Fibonacci coefficients truly "work" in analyzing financial markets (including the Forex market), the best way is to verify or refute it through your own experience.
According to common sense, there is only one explanation why Fibonacci graphical tools (and most technical analysis indicators in general) can work - because many traders worldwide use them in their everyday trading and rely on them to generate trading signals. These indicators are already embedded in the market's behavioral psychology, which is why they work. However, unlike technical indicators that have a clear mechanism for generating trading signals in their theory, Fibonacci graphical tools do not have strict \"action guides\". They simply provide some assumptions about future support and resistance levels or lines.